Musings and confusings. All things DFIR.

Category: Command Line Page 1 of 2

Generating File System Listings from the Command Line (with Full MACB Timestamps and Hashes)

!!IMPORTANT NOTE!!
———————————-
Before you go testing/implementing the commands that are described in this article, PLEASE ensure you first understand the following major caveat of performing certain actions/commands against files on a live system:

Reading a file changes its atime eventually requiring a disk write, which has been criticized as it is inconsistent with a read only file system.”
https://en.wikipedia.org/wiki/Stat_%28system_call%29#Criticism_of_atime

You DO NOT WANT TO DO THIS on a target of which you are attempting to perform forensic analysis.

Further reading on the matter
https://superuser.com/questions/464290/why-is-cat-not-changing-the-access-time

When in doubt and/or fear of possibly affecting a target system’s access timestamps, you should ensure the following is true before running the below commands:

  • The target file system (or whatever directory you are running this against) has been (re)mounted read-only and/or with the “noatime” and/or “relatime” mount parameters.

If you’re planning to run these commands against a physical disk (image), you can mount the target disk’s filesystem read-only via the following:

$ sudo mount -o ro,... </src/disk> </mount/point>

If you’re planning to run these commands against a live system, you can remount the live root filesystem/directory using the mount command’s --bind option via the following:

$ mkdir /mnt/remount

$ sudo mount --bind / /mnt/remount

Now, while the root filesystem/directory will be re-mounted to a new mount point, it will still be mounted read-write by default. So, before you go accessing anything on it, you need to re-mount it (yes, again) read-only, like so:

$ sudo mount -o remount,ro,bind,noatime /mnt/remount

Note that you don’t necessarily need the noatime attribute given that you’re already mounting the system read-only (and, in theory, should not be modifying any of the file timestamps upon access). However, I’m a “belt and suspenders” kind of guy. So, I’d rather have redundancy, even if unneeded, for the peace of mind.

———————————-

Disclaimer: I did not search the internet for a solution to this article’s challenge as I wanted to come up with one myself. Thus, a solution may already exist that is similar (or not). However, the point of the below article was not to just find a solution and move on. Rather, I wanted to walk readers through a problem statement, step-by-step piecing together a solution, thoroughly documenting and “teaching a man to fish” versus just giving out a fish. That said, I am in no way guaranteeing the below commands to work perfectly in ensuring it finds and properly processes every single file on the filesystem. In fact, when running this live, we are actively avoiding certain areas of the filesystem that are actively changing/ephemeral to minimize the error outputs. The only thing I can guarantee, in true *nix ad-hoc one-liner development, is (dis)function in ways beyond the imagination. ‘Tis a fact we just live with. This post simply describes *options* you can add to your toolkit that can always very much benefit from testing, troubleshooting, and improving.

In addition, while I attempted to identify and explain various aspects of each of my commands, I recognize that there are still improvements that can be done to this command. I attempted to find the balance of thorough explanation and efficiency while not bleeding over into the esoteric.

TL;DR – YYMMV*

*The first Y stands for “Yuuuuuuge”

Enough with the caveats and disclaimers, let’s get down to it…

Linux

Recently, a teammate posed a request to be able to generate a file listing of a directory in Linux showing the size and hash of each file in the output format of “ls -lhS” (list files in long format, with human-readable sizes, in decreasing size output).

As I hit Reply to the email, my initial thoughts were “Why don’t you use FLS?” as that is essentially the de-facto standard for producing a file system listing from an image. However, I got to thinking… FLS doesn’t really provide a comprehensive solution here for a few reasons:

  1. We need a command to run against a LIVE system and FLS only runs against a dead system image*
  2. FLS requires a second step to convert its output to bodyfile format for human-readable timestamps
  3. FLS doesn’t perform any file hashing

*Actually, this is not true. As one of my colleagues ever-so-graciously reminded me… Although it is not well documented, FLS can run against live systems. You can run it against a live Windows system by using named pipes, a la “fls [options] \\.\<X>:“, where <X> is a logical drive letter like C:, D:, etc.  And, a September 2011 SANS blog post here describes it in operation for Windows. To run it against a live Linux or Mac/OS X system, you may do so as such “fls [options] /dev/sd<X><Y>“, where <X> is the physical drive letter like /dev/sda, /dev/sdb, etc. and <Y> is the partition number like /dev/sda1, /dev/sda2, etc.

At any rate, the last two points remain, so it’s good thing I waited to hit send before looking like a dummy.

Instead, I took the challenge in attempting to come up with a command line one-liner to provide what was requested. Initially, I came up with the following:

$ find /path/to/dir -maxdepth 1 -type f -print0 | xargs -0 -r ls -lh | awk '{cmd="md5deep -q "$9; cmd | getline md5; close(cmd); cmd="sha1sum "$9; cmd | getline sha1; close(cmd); print $1","$2","$3","$4","$5","$6" "$7" "$8","$9","md5","sha1}' | awk '{$NF=""}1' | sed 's/ ,/,/g’ | sort -t',' -hr -k5


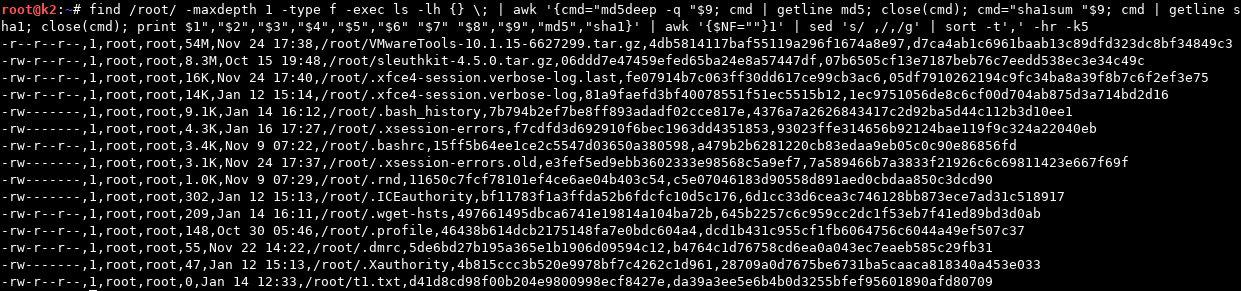
*You may need to Right-Click and Open/View Image in New Tab to see these inserted screenshots in full resolution. Sorry about that.

However, as we can see here, the timestamps produced from a simple “ls -lh” were rather lacking in both what was provided (solely last modification time by default) as well as precision (only precise to the second by default*, and a LOT can happen on a system in a singular second that we’d need to distinguish during an investigation).

== Sidebar 1 ==
You might be wondering why I am piping find’s output to xargs to execute the “ls -lh” against the results versus simply using find’s built-in “-exec” parameter that ostensibly does the same thing. In short, this is for performance reasons which you can read about at the below links.
https://www.everythingcli.org/find-exec-vs-find-xargs/
https://www.endpoint.com/blog/2010/07/28/efficiency-of-find-exec-vs-find-xargs
== /Sidebar 1 ==

== Sidebar 2 ==
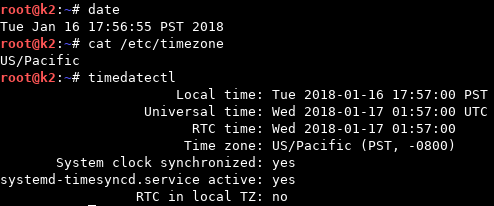
Also note that all timestamps will be in the system’s local time. So, it would behoove you to collect that information from the system as well for future reference during analysis. This can be done a few different ways, as shown below:

== /Sidebar 2 ==

In light of the aforementioned issues (lacking additional timestamps and precision), I worked through a few different solutions and came up with the following which included not only timestamps with much greater precision (now with full nanosecond precision*) but also included all of the GNU “find” command’s printable timestamps (i.e., Last Modified, Last Accessed, and Inode Changed).

$ find /root -maxdepth 1 -type f -printf '%i,%M,%n,%g,%u,%s,%TY-%Tm-%Td %TT,%AY-%Am-%Ad %AT,%CY-%Cm-%Cd %CT,”%p"\n' | awk -F"," '{cmd="md5deep -q "$9; cmd | getline md5; close(cmd); cmd="sha1sum "$9; cmd | getline sha1; close(cmd); print $1","$2","$3","$4","$5","$6","$7","$8","$9","md5","sha1}' | awk '{$NF=""}1' | sed 's/ ,/,/g’ | sort -t',' -hr -k5

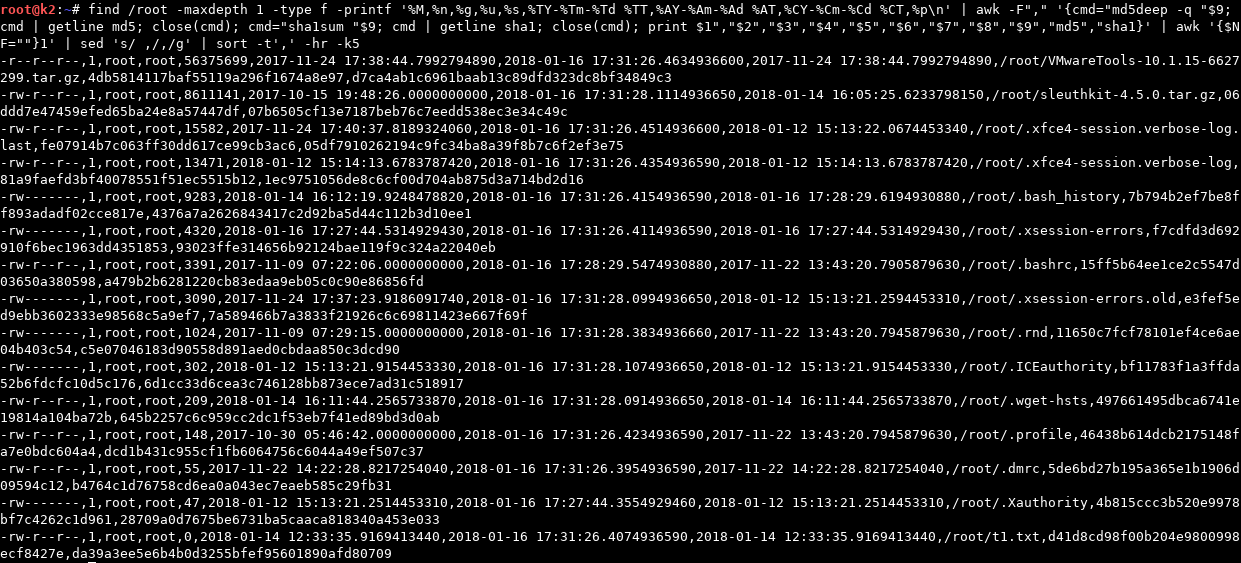
**Note that printf’s time field format is precise to 10 digits, while nanoseconds are (by definition) only precise to 9 digits. Thus, it is appending a 0 in the 10-th digit spot. Why? I frankly don’t know. I mean… uhh… “the reason of which will be left as an exercise to the reader.” 🙂

== Sidebar 3 ==
*I later discovered that you can show timestamps with full nanosecond resolution in ls via the “–full-time” parameter as I will show below.

$ ls -l --full-time
total 55088
drwxr-xr-x 2 root root 4096 2017-11-22 14:22:30.165725454 -0800 Desktop

== Sidebar 3 ==

At any rate, we’re making progress, but we’re still missing something. What about Inode (File) Creation? Is that not recorded in Linux? In short, Ext3 filesystems only record Last Modified (mtime, Last Accessed (atime), and Inode Changed (ctime), while Ext4 filesystem (on which a large majority of Linux distress operate) fortunately include the additional Inode Creation time (crtime). Lucky for us, I am doing this on an Ext4 filesystem, so we should be seeing those times if they’re implemented and recorded, right? You’d think so… but you’d be wrong.

Unfortunately, Linux decided not to implement an easy way (aka a natively integrated API) to view/include these (crtime) timestamps in various tools’ output (as seen here in the “find” command, and shortly in the “stat” command). Alas, FRET NOT, as there is a way to extract this timestamp using the debugfs utility. Intended as a “ext2/ext3/ext4 file system debugger”, it provides a “-R” option to execute a given command for debugging purposes. We will (ab)use this option to extract more information (i.e. the crtime timestamp) from the “stat” command than is originally provided by running the command on its own.

First, we will run “stat” against a file:

$ stat /root/VMwareTools-10.1.15-6627299.tar.gz
File: /root/VMwareTools-10.1.15-6627299.tar.gz
Size: 56375699 Blocks: 110112 IO Block: 4096 regular file
Device: fe01h/65025d Inode: 405357 Links: 1
Access: (0444/-r--r--r--) Uid: ( 0/ root) Gid: ( 0/ root)
Access: 2018-01-12 15:16:03.524147591 -0800
Modify: 2017-11-24 17:38:44.799279489 -0800
Change: 2017-11-24 17:38:44.799279489 -0800
Birth: -

Now, we will use the “debugfs” command to get the Inode/File Birth (crtime) timestamp. Keep in mind, you will need to provide the volume/partition on which the referenced file resides as a parameter to the command, otherwise the command will not work (namely yielding a “No such file or directory while opening filesystem” error). For my example below, my system is using LVM volumes and the file we’re querying resides on my root “k2–vg-root” LVM volume/partition.

$ debugfs -R 'stat /root/VMwareTools-10.1.15-6627299.tar.gz' /dev/mapper/k2--vg-root
Inode: 405357 Type: regular Mode: 0444 Flags: 0x80000
Generation: 763788199 Version: 0x00000000:00000001
User: 0 Group: 0 Project: 0 Size: 56375699
File ACL: 0 Directory ACL: 0
Links: 1 Blockcount: 110112
Fragment: Address: 0 Number: 0 Size: 0
ctime: 0x5a18c9a4:be902604 -- Fri Nov 24 17:38:44 2017
atime: 0x5a5941b3:7cf76e1c -- Fri Jan 12 15:16:03 2018
mtime: 0x5a18c9a4:be902604 -- Fri Nov 24 17:38:44 2017
crtime: 0x5a18c9a4:5740e928 -- Fri Nov 24 17:38:44 2017
Size of extra inode fields: 32
Inode checksum: 0x53c3b2b6
EXTENTS:
(0-10239):1859584-1869823, (10240-12287):1873920-1875967, (12288-13763):1902149-1903624

There’s actually a lot of great output here that can be very useful to us as forensic analysts, but we really only need the crtime for our purposes today. So, we can do a little command-line fu to just extract the human readable portion of the crtime timestamp we care about.

$ debugfs -R 'stat /root/VMwareTools-10.1.15-6627299.tar.gz' /dev/mapper/k2--vg-root |& sed -n 's/^crtime.*- \(.*\)$/\1/p'
Fri Nov 24 17:38:44 2017

To go a bit further and match stat’s default timestamp formatting, we can do a bit more command-line fu to yield the following:

$ date +"%Y-%m-%d %H:%M:%S.%N %z" -d "$(debugfs -R 'stat /root/VMwareTools-10.1.15-6627299.tar.gz' /dev/mapper/k2--vg-root |& sed -n 's/^crtime.*- \(.*\)$/\1/p')"
2017-11-24 17:38:44.000000000 -0800

Great, now we have a crtime (Inode/File Creation) timestamp we know and love. But, wait… anyone else noticing something here? The nanoseconds are all zeroes. Hmmm. Well, if we trace our process back a bit, we can see that this is because we are attempting to produce a nanosecond-precision datetime object from a source that obviously doesn’t include it. Obviously, we can’t extract nanosecond precision from an input that doesn’t contain it. So, where do we go from here?

Well, if we look back at the crtime output (crtime: 0x5a18c9a4:5740e928 -- Fri Nov 24 17:38:44 2017) we can see that the second column there contains two sets of hex digits (0x5a18c9a4:5740e928) delineated by a colon. Could it be that this is simply a hex version of the decimal and nanosecond epoch timestamps? Oh, it could, and it is. It turns out the first entry (previous to the colon) is the epoch seconds and the second entry (after the colon) is the nanoseconds. So, we’ll need to go back to our command and alter it to extract, convert, and construct the nanosecond epoch timestamp we’re looking to produce.

The below command extracts both the first and second set of hex digits (epoch seconds and epoch nanoseconds, respectively), converts both of the hex sets to decimal, converts the epoch seconds to a human-readable datetime object using Awk’s strftime formatting, and then divides the nanoseconds portion by four (essentially performing a two-bit shift) as is necessary per Hal Pomeranz’s article on EXT4 Timestamps here.

**Big thanks to Dan (aka @4n6k) for his assist here in leading me to Hal’s article as I was banging my head on this last portion for a bit until discovering this bitwise shift needed to be done. Also, of course, huge thanks to Hal (@hal_pomeranz) as well for this monumental efforts in painstakingly documenting EXT4 Timestamps and these nuances.**

$ debugfs -R 'stat /root/VMwareTools-10.1.15-6627299.tar.gz' /dev/mapper/k2--vg-root |& sed -n 's/^ mtime: \(0x[0-9a-f]+\):\([0-9a-f]+\).*/\1.0x\2/p' | awk -F'.' '{n = strtonum($2) / 4; print strftime("%Y-%m-%d %T",strtonum($1))"."n}'
2017-11-24 17:38:44.799279489

AWESOME. We can now successfully extract the crtime file timestamps programmatically.

Now, let’s put it alllll together and build our one-liner that’s going to help us reach our original goal here of outputting a file listing with all the available timestamps (in MACB order) as well as file hashes (MD5 and SHA1). We will be using the largely native md5sum and sha1sum utilities to produce our hashes so as to avoid the need to install any additional third-party tools.

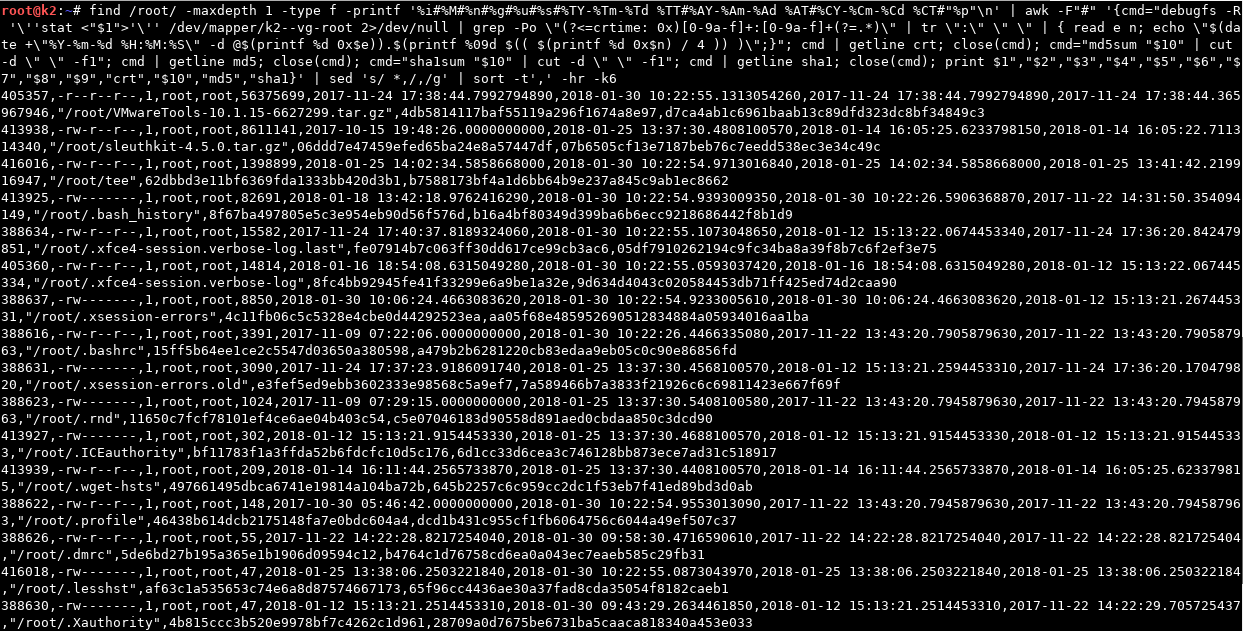
And, here it is. I give the ugliest (most epic?) command to date to output everything we’ve been looking for:

# find /path/to/dir -maxdepth 1 -type f -printf '%i#%M#%n#%g#%u#%s#%TY-%Tm-%Td %TT#%AY-%Am-%Ad %AT#%CY-%Cm-%Cd %CT#"%p"\n' | awk -F"#" '{cmd="debugfs -R '\''stat <"$1">'\'' /dev/mapper/k2--vg-root 2>/dev/null | grep -Po \"(?<=crtime: 0x)[0-9a-f]+:[0-9a-f]+(?=.*)\" | tr \":\" \" \" | { read e n; echo \"$(date +\"%Y-%m-%d %H:%M:%S\" -d @$(printf %d 0x$e)).$(printf %09d $(( $(printf %d 0x$n) / 4 )) )\";}"; cmd | getline crt; close(cmd); cmd=“md5sum "$10" | cut -d \" \" -f1"; cmd | getline md5; close(cmd); cmd="sha1sum "$10" | cut -d \" \" -f1"; cmd | getline sha1; close(cmd); print $1","$2","$3","$4","$5","$6","$7","$8","$9","crt","$10","md5","sha1}' | sed 's/ *,/,/g’ | sort -t',' -hr -k6

Note that we had to do a few things to deal with various unsavory characters that may occur within filenames (e.g., spaces, parentheses, comma’s, etc.). First, we can’t use comma’s as our print output delimiter as filenames with comma’s would then screw up our Awk parsing. So, we needed to use a non-standard character (i.e. one we would never expect to see in our output). In this case I chose “#”, but you could use whatever you’d like. To get our debugfs stat output, as well as MD5 and SHA1 hashes, we utilize Awk’s ability to execute commands and retrieve the output with its getline function. You may notice that the debugfs stat command one-liner strings together a RegEx with a Lookbehind assertion, along with some bash read/print/date functions in order to translate the hex -> decimal -> formatted human-readable datetime for us.

So… How ‘bout them apples?? WE’VE DONE IT!! All of that painstaking work has paid off in spades. We’ve put together a command that is essentially FLS on steroids (with hashes) that we can run against BOTH a live and dead system! THIS IS WHAT DREAMS ARE MADE OF!

If you’d like to use this* as an FLS replacement against a (dead) system image, simply mount the image’s file system (Read-Only, of course), adjust the command to point to the root of the file system, remove the last “sort” command (as we can do that later during analysis as needed), and simply output to CSV. Like so:

*AGAIN, I PROVIDE NO GUARANTEES HERE, only a best effort here and initial pass on doing this. For example, in one of my test VM’s I kept getting what appeared to be random “sh: 1: printf: 0x: not completely converted” errors that output a default crtime date of “1969-12-31 16:00:00.000000000” which makes no sense as I’ve verified that the crtimes on these files are present and properly output via stat/debugfs and a manual conversion of the values yields success. Yet, it did not happen in other VM’s. So, just a heads up in case something goes awry on your end.

# echo "Inode,Permissions,HardLinks,GroupName,UserName,Size(Bytes),LastModified,LastAccess,Changed,Birth,Filename,MD5,SHA1" > FS_Listing.csv

# find / -xdev ! -path '/var/run/*' ! -path '/run/*' ! -path '/proc/*' -type f -printf '%i#%M#%n#%g#%u#%s#%TY-%Tm-%Td %TT#%AY-%Am-%Ad %AT#%CY-%Cm-%Cd %CT#"%p"\n' | awk -F"#" '{cmd="debugfs -R '\''stat <"$1”>'\'' /dev/mapper/k2--vg-root 2>/dev/null | grep -Po \”(?<=crtime: 0x)[0-9a-f]+:[0-9a-f]+(?=.*)\" | tr \":\" \" \" | { read e n; echo \"$(date +\"%Y-%m-%d %H:%M:%S\" -d @$(printf %d 0x$e)).$(printf %09d $(( $(printf %d 0x$n) / 4 )) )\";}"; cmd | getline crt; close(cmd); cmd="md5sum "$10" | cut -d \" \" -f1"; cmd | getline md5; close(cmd); cmd="sha1sum "$10" | cut -d \" \" -f1"; cmd | getline sha1; close(cmd); print $1","$2","$3","$4","$5","$6","$7","$8","$9","crt","$10","md5","sha1}' | sed 's/ *,/,/g' >> FS_Listing.csv

Note that we are:

  1. First writing a “header” line to the CSV file for easier reference during analysis
  2. Now operating from a ROOT prompt (e.g. the leading “#” denoting a root prompt versus the “$” denoting a standard user prompt) as we will need root privileges to access/read the entire filesystem
  3. Avoiding traversal of external mounted filesystems (i.e. network shares, external media, etc.) via the “-xdev” parameter, and
  4. Specifically avoiding a few directories via the “! -path /path/to/avoid/*” as the aforementioned paths store ephemeral process information we aren’t interested in collecting (at least not for our purposes here).

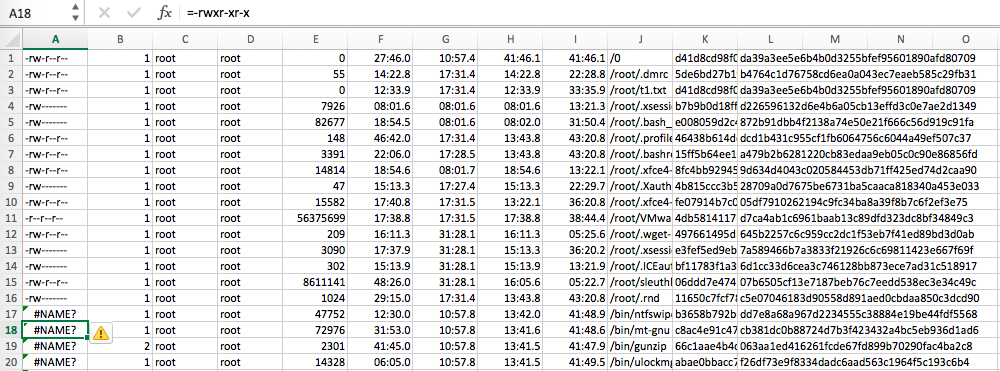
Excel ProTips: If you are using Excel to review the CSV file, be aware that Excel only displays time precision down to the milliseconds (and no further). Alas, you will be missing everything beyond the 3 digits past the decimal place. In order to display this millisecond precision, you will want to highlight all the MACB timestamp cells, right-click, select Format Cells, select Custom under the Number tab, input the Type as mm/dd/yyyy hh:mm:ss.000 (or whatever you like, the important part is the timestamp’s trailing .000), then click OK. And, Voila!, millisecond timestamp precision. Obviously, it is most valuable to be able to actually see the full nanosecond precision but at least it’s something for those who are die-hard Excel fans.

Also, for whatever reason, Excel does something weird with displaying some of the leading permissions entries by prepending a “=“ to them. Why, I have no idea. Maybe Excel gets confused and sometimes tries to interpret “-“ text as an intended negative or minus sign and thus attempts to “fix” it for us (in true Microsoft fashion) by denoting it as a formula and prepending the “=”? ¯\_(ツ)_/¯ For whatever reason, it’s happening (see below). Just be aware that this is something Excel is adding and that it is NOT present in the original CSV if you’re using any other tools for analysis.

Now… how about doing this on a Mac? OF COURSE we’re going to translate this over…

Mac

If you’ve been reading my blog (and/or working between Linux and Mac systems for a while), you’ll know that things do not often translate directly to from Linux (GNU) to Mac (BSD) as the core utilities seem to always differ just enough to make your life a pain when working between systems. And, this situation is no different.

As you might assume, we are going to use the “stat” command again as the basis for extracting all of our timestamps. However, we will of course be using the BSD stat command and not the GNU version as used in Linux. Below is the default BSD “stat” output (the format of which is of course different from GNU “stat” because… why not):

$ stat .vimrc
16777220 1451064 -rw-r--r-- 1 jp staff 0 54 "Sep 22 12:08:02 2017" "Dec 26 10:36:32 2016" "Dec 26 10:36:32 2016" "Dec 26 10:12:15 2016" 4096 8 0 .vimrc

The upside here is that, by default, BSD “stat” outputs all 4 HFS+ filesystem timestamps we care about! Great, but which are what? Saving you some time and research, BSD “stat” outputs timestamps in the following order by default:

Last Accessed, Last Modified, Inode Changed, Inode Birth - (A,M,C,B)

Just as we discussed earlier, these reflect the time file was last accessed, the time the file was last modified, the time the inode was last changed, and birth time of the Inode. So, in order to get them into an order we like (okay, the order that I like) such as MACB (because this is how we most often see the timestamp acronym), we can perform the following:

$ stat -t "%b %-d %Y %T %Z" .vimrc | awk -F'"' '{print "Modified: "$4; print "Accessed: "$2; print "Changed: "$6; print "Birth: "$8}'
Modified: Dec 12 2016 10:36:32 PST
Accessed: Sep 9 2017 12:08:02 PDT
Changed: Dec 12 2016 10:36:32 PST
Birth: Dec 12 2016 10:12:15 PST

And, there we have it, full timestamp information in the order we (I) like it. Do note that HFS+ timestamp precision is only down to the second as it does not implement nanosecond resolution like some other filesystems. And, for that, we do a hearty ¯\_(ツ)_/¯. Fortunate for us in the future, APFS has implemented nanosecond timestamp resolution. But, that’s a separate discussion you can read about here.

Now that we’ve taken care of that timestamp acquisition and formatting issue, let’s move on to building the command line statement we’re going to run. While GNU’s find utility provides a “-printf” option to format and customize find’s output, BSD’s find lacks such an option. Alas, we will need to be a bit more creative here. What I ended up doing here was piping find’s output to BSD’s “stat” command which DOES provide a formatting option “-f” that we can utilize. But, again, it’s not as straight forward as just copy/paste of the previous formatting we used on Linux because OF COURSE the print delimiters don’t directly translate over either.

So, first we need to translate over the previous GNU print formatting string ('%i#%M#%n#%g#%u#%s#%TY-%Tm-%Td %TT#%AY-%Am-%Ad %AT#%CY-%Cm-%Cd %CT#”%p”\n') into the correlated BSD values, which end up being the following:

'%i^%Sp^%l^%Sg^%Su^%z^%Sm^%Sa^%Sc^%SB^"%N"'

I’m using “^” as a delimiter this time instead of “#” as I ended up actually having files with hash/pound signs in their name on my system (THANKS, ATOM APP). Also, note that I’m using single-tick’s for the print statement and using full quote encapsulation for the filename. I’m doing this in order to avoid issues with dollar signs ($) in filenames. Again, no, using such delimiters is not very pretty, but it’s required. And, if you for some reason have files with “^” in their names, it will break this as well. So, YMMV.

$ find /Users/jp -maxdepth 1 -type f -print0 | xargs -0 stat -t "%Y-%m-%d %H:%M:%S" -f '%i^%Sp^%l^%Sg^%Su^%z^%Sm^%Sa^%Sc^%SB^"%N"' | sort -t'^' -nr -k6

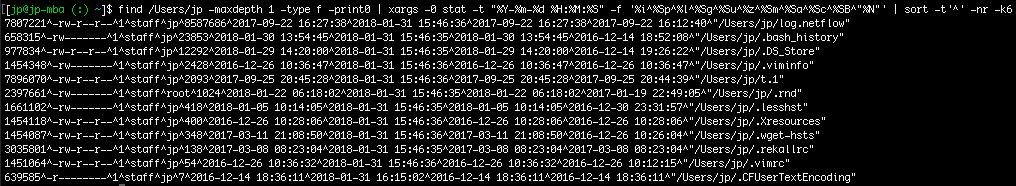
Note that I also needed to specify stat’s “-t” argument to format the datetime output in the printf statement.

So, there we have it, listing directory output in decreasing file size.

Now, on to calculating and appending our MD5 and SHA1 hashes to the output. For this, we will use BSD’s native md5 and shasum utilities. Using much of the same structure from our Linux one-liner, we then come up with the following:

# find /Users/jp -maxdepth 1 -type f -print0 | xargs -0 stat -t "%Y-%m-%d %H:%M:%S" -f '%i^%Sp^%l^%Sg^%Su^%z^%Sm^%Sa^%Sc^%SB^"%N"' | awk -F"^" '{cmd="md5 "$11" | cut -d \" \" -f4"; cmd | getline md5; close(cmd); cmd="shasum "$11" | cut -d \" \" -f1"; cmd | getline sha1; close(cmd); print $1","$2","$3","$4","$5","$6","$7","$8","$9","$10","$11","md5","sha1}' | sort -t',' -nr -k6

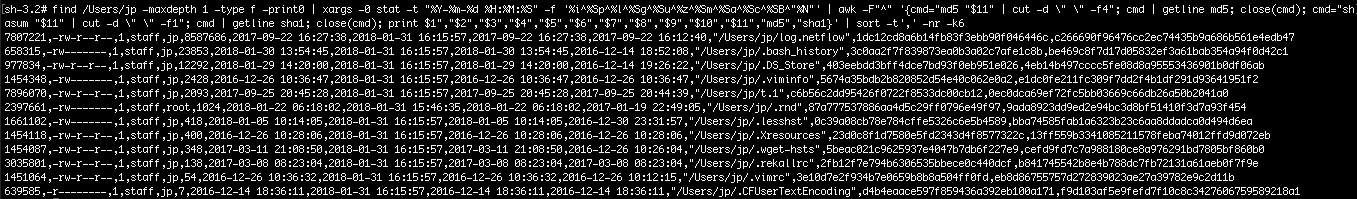
And there we have it, a directory listing with hashes sorted in decreasing file size. Note that were are now again in a root shell to avoid file access permissions.

Now, on to the final one-liner to do a full filesystem listing:

# echo "Inode,Permissions,HardLinks,GroupName,UserName,Size(Bytes),LastModified,LastAccess,Changed,Birth,Filename,MD5,SHA1" > OSX_Listing.csv

# find -x / -type f -print0 | xargs -0 stat -t "%Y-%m-%d %H:%M:%S" -f '%i^%Sp^%l^%Sg^%Su^%z^%Sm^%Sa^%Sc^%SB^"%N"' | awk -F"^" '{cmd="md5 "$11" | cut -d \" \" -f4"; cmd | getline md5; close(cmd); cmd="shasum "$11" | cut -d \" \" -f1"; cmd | getline sha1; close(cmd); print $1","$2","$3","$4","$5","$6","$7","$8","$9","$10","$11","md5","sha1}' >> OSX_Listing.csv

Note that OS X find’s “-x” parameter is equivalent to GNU’s “-xdev”, meaning not to enumerate external disks/mounted filesystems.

When I ran this against my full system, I realized it choked on files containing “$”. So, I needed to add in some Awk substitution to escape the dollar sign with a leading “\” so that the shell wouldn’t attempt to interpret the “$” as (mis)indication of a variable when it was simply a dollar sign in a file name. Full disclosure: it may also choke on other files with special characters, but I’ve shown you how you can use Awk substitution as a way around it. So, update/augment this as needed.

Conclusion

Sooooo, Wow. That was a bit of hard work. Actually, it was A LOT of hard work, much of which was not captured in the blog post for the sake of brevity and everyone’s sanity, as it surely tested mine many a time. However, hopefully you can see the value of spending the time building effective and efficient processes on the front end so you are not always paying for it on the back end. Suffice to say, IMHO, sometimes it is ok to work harder and not smarter, when the process will help you become more of the latter.

If you wanted to run any of the above commands against a mounted evidence image, you’d simply specify its mount point in the find command, like so:

# find /mnt/point/ ...

Note that we don’t use the “-xdev” or “-x” parameter here as we do actually want it to enumerate an external filesystem (i.e. our mounted evidence image’s filesystem which is likely from an external disk or network share).

And, now that we’ve walked through doing all of that the hard way using native Linux utilities, I will say that another filesystem enumeration capability to include hashes has also been built in Python in Jim Clausing’s macrobber.py script. However, due to Python’s os.stat call limitations, this script does not/cannot pull the btime (aka crtime) attributes that we are able to identify and extract through our commands here. Nonetheless, it is another option, which is always great.

Thanks to everyone for hanging in there through this whole post. It obviously takes way more time to painstakingly walk through every step of a process; however, I feel it is well worth my time to teach people to fish, and hopefully you all do too.

Decompressing and Extracting Artifacts from Windows 8 / Server 2012+ Hibernation Files

Windows Hibernation files from a hibernated (or sometimes simply shutdown) machine can be a wealth of information in investigations, often containing a nearly complete memory image of what was running on the system prior to hibernation (shutdown). For years, many in the DFIR community have pillaged the hibernation file for a variety of artifacts, ranging from extraction of simple strings to the use of more specialized analysis tools like Mathieu Suiche’s Hibr2Bin and Volatility. However, since Windows 8, you may (or may not) have noticed that the number of artifacts extracted by the usual methods have at times ranged from substantially less to nearly nonexistent.

So, what gives? Does Microsoft simply no longer store (as many) artifacts in there anymore? I mean, if our trusted tools can’t identify/extract it, it’s surely not there, right? Well, while it would be easy to simply move on and accept the loss of artifacts, I’d like to take the time to dig a bit deeper and find out what is going on here.

Background

Windows hibernation files are compressed at shutdown. Starting in Windows XP, Microsoft began using the Xpress compression algorithm with a defined data structure of which many tools (including the aforementioned Hibr2Bin and Volatility) had down pat to properly decompress and extract/display the contained artifacts. However, beginning in Windows 8/Server 2012, Microsoft changed things up, namely adding a Huffman encoding variant and changing the data structures a bit. This, in turn, rendered existing decompression tools severely hindered without a rewrite to account for the changes. As of this writing, while it appears there is some work in progress to update both Hibr2Bin and Volatility to update the decompression methods, neither of these tools can successfully fully decompress Windows 8+ Hibernation files. Though, I believe the DFIR community eagerly awaits updates to these tools as they have both proven to be incredibly useful in their own respects.

== Sidebar ==

For those interested in the nitty gritty details of Windows hibernation files, refer to Joe T Sylve, Vico Marziale, and Golden G. Richard III’s excellent paper titled “Modern windows hibernation file analysis” that describes in great detail the various Windows hibernation file formats/structures, along with their testing methodology using Hibr2Bin to attempt to decompress each Windows version’s hibernation files. You will see the issue of the changed compression structure evident in their testing with Hibr2Bin in that they saw it only produced a subset of expected decompressed artifacts and “surmised that Hibr2Bin must only decompress the first restoration set of pages that are restored by the boot loader, ignoring the second set of kernel-restored pages.” We can assume the same and/or similar issue(s) of not yet being able to properly read and entirely parse the new data structures also apply to Volatility.

== /Sidebar ==

So, the information is still there, we just have to figure out a different way (or use a different tool) to get to it. But, before we go on, let’s recap a bit about our previous go-to Hibernation file decompression tools.

On September 20, 2016, Matthieu Suiche released (open sourced) his Hibr2bin (Hibernation file decompression) and DumpIt (memory image collection) utilities. However, as of this latest release, the Hibr2bin tool only supports comprehensive decompression of Hibernation files up through Windows 7. Though it states support for Windows 8 and 10 systems, it has been demonstrated to not fully decompress the file (of which Mathieu is currently aware). Though, the tool is open source now, so the community has full access to build these changes in themselves without relying on Mathieu to do it.

Though Volatility’s imagecopy plugin will work to decompress/convert Windows XP through Windows 7Hibernation files to a raw memory dump for analysis, it does not currently support Windows 8/Server 2012+ Hibernation file decompression (https://github.com/volatilityfoundation/volatility/issues/25). That said, it is still able to properly parse and analyze a decompressed Hibernation files through the latest version(s) of Windows 10/Server 2016, should you be able to decompress the Hibernation file by some other means/tool.

So, where does this leave us if our go-to tools no longer work to fully decompress Hibernation files from Windows 8/Server 2012+ systems? Are we up Schitt’s Creek (HILARIOUS show BTW, please do check it out) without a paddle?

Enter Arsenal Recon.

The folks that brought you Registry Recon and Arsenal Image Mounter have since developed Hibernation Recon, which as of this post appears to be the only tool currently available that supports comprehensive decompression of Windows hibernation files through the latest Windows 10 releases.

I’ve extracted the below pertinent information from their web page:

Hibernation Recon has been developed to not only support memory reconstruction from Windows XP, Vista, 7, 8/8.1, and 10 hibernation files, but to properly identify and extract massive volumes of information from the multiple types (and levels) of slack space that often exist within them…

Features:
* Windows XP, Vista, 7, 8/8.1, and 10 hibernation file support
* Active memory reconstruction
* Identification and extraction of multiple levels of slack space
* Brute force decompression of partially overwritten slack
* Segregation of extracted slack based on particular hibernations
* Proper handling of legacy hibernation data found in modern hibernation files
* NTFS metadata recovery with human-friendly decoding
* Parallel processing of multiple hibernation files”

As of the March 7, 2017 release, the team currently offers both a paid and free version…

Hibernation Recon is priced at just $399 to ensure every digital forensics expert can properly arm themselves. If Hibernation Recon is run without a license, a “Free Mode” is provided which supports the extraction of active contents from both legacy and modern Windows hibernation files.

As a major bonus and rarity for the “Free” version of a tool, the “Free Mode” version is allowed for both personal AND commercial use. NOICE! Big kudos to these guys for allowing this!

Do note that the hibernation slack & NTFS metadata recovery functionality is only available within the professional version, which I would imagine could be very useful as well. However, for the sake of brevity, access, and initial focus of my testing (i.e., successful comprehensive decompression) I am simply testing the “Free Mode” version. Perhaps I can get my hands on the Pro version at some point to test those additional recovery features…

At any rate, I downloaded the tool from the website and got on my way to testing using the “Free Mode”.

Testing

For testing, I first enabled hibernation via the command line (> powercfg -h on) and then generated three different hibernation files by performing the following procedures on my Windows 10 Pro desktop system:

Booted

  1. Enable Hibernation
  2. Hibernate the machine via Right-click Windows button -> Hibernate
  3. Boot the machine
  4. Log into the system and copy the existing hiberfil.sys via FTK Imager

Hibernated

  1. Enable Hibernation
  2. Hibernate the machine via Right-click Windows button -> Hibernate
    1. This can also be done via “shutdown /h” on the command line
  3. Boot into live linux environment and copy the existing hiberfil.sys

Shutdown

  1. Enable Hibernation
  2. Shut down the system
  3. Boot into live linux environment and copy the existing hiberfil.sys

With the 3 resulting hibernation files generated by the above methods, I could now test and measure the following:

  1. If, and how well, Hibernation Recon decompresses each Hibernation file
  2. How much information, if any, each Hibernation file contains (i.e., which collection method yields the greatest amount of artifacts and information)

With the data and aforementioned goals in hand, I ran Hibernation Recon* against each Hibernation file so that I had both a native compressed file and (supposedly) fully decompressed file for performing comparison.

*Note: I did not test Hibr2bin against these images as Sylve, Marziale, and Richard III had already done so as outlined in their previously mentioned paper on the subject.

I then ran the following tools against both the native compressed and decompressed images for each collection method (booted, hibernated, and shutdown) to collect a relatively representative set of results for quantitative comparison*:

*I’m no data scientist, I just attempted a testing methodology that I considered to have the greatest layman’s ROI

  1. GNU Strings
    Not too much to explain here, I simply wanted to identify all occurrences of strings (both unicode and ASCII) within each image.
  2. Page_Brute
    This tool is designed to run Yara signatures against each block (4096 bytes) of a pagefile. However, I wanted to test it against the Hibernation file as it also uses 4096 byte pages and well… there’s really nothing to lose in testing it. I added signatures to the default_signatures.yar ruleset file to also identify IP addresses, Email addresses, and URL’s – all useful artifacts of which we’d expect to find in a memory image and thus I figured a good method for comparison.
  3. Bulk_Extractor
    Copied/pasted directly from the user manual, “bulk_extractor operates on disk images, files or a directory of files and extracts useful
    information without parsing the file system or file system structures. The input is split into pages and processed by one or more scanners.
    ” It is a beautiful thing in that it is EXTREMELY well threaded and as such will hog as much of your system’s resources as it is allowed. Though caution must be exercised here in light of that, letting it run full throttle on a dedicated machine yields some insanely fast (not to mention very intelligent) artifact parsing and extraction. The quantity of identified and extracted artifacts are a good measure of how much decompressed data (in terms of Hibernation file decompression, not decompression of standard files like zip, rar, etc. that is also built into the tool) is available within the image.
  4. Volatility 2.6
    Run Volatility’s imagecopy plugin against the native compressed image to attempt to decompress/convert it to a raw image. Then, run Volatility with the appropriate system profile against the Volatility decompressed/converted image and the Hibernation Recon decompressed image. Various plugin output can then be compared across images to see which produces the greatest amount of artifacts parsed from the memory image.

Results

== Legend ==
JPW10_hiberfil.sys = Hibernation file from Shutdown system
JPW10_hiberfil.sys_2 = Hibernation file from Hibernated system
JPW10_hiberfil.sys_3 = Hibernation file from Booted system
ActiveMemory.bin = Decompressed and reconstructed memory image via Hibernation Recon

Strings, Page_Brute, and Bulk_Extractor data:
Hibernation_Testing_Results

“Booted” System Results
See spreadsheet for Strings, Page_Brute, and Bulk_Extractor data.

As we can verify here, the contents of the Hibernation file are zeroed upon system boot, which is stated to be the case in Windows 8+ systems. Thus, as we’d expect, no results from using any of the tools and no reason to use Hibernation Recon against the Hibernation file (nothing there to decompress).

“Hibernated” System Results
See spreadsheet for Strings, Page_Brute, and Bulk_Extractor data.

Volatility
Attempt to convert/decompress native hibernation file to use with Volatility…
$ python ~/volatility/vol.py -f Hibernated/JPW10_hiberfil.sys_2 --profile=Win10x64_14393 imagecopy -O Hibernated/Output/JPW10_hiberfil.sys_2_conv

Run pslist plugin against resulting file…
$ python ~/volatility/vol.py -f Hibernated/Output/JPW10_hiberfil.sys_2_conv --profile=Win10x64_14393 pslist
Volatility Foundation Volatility Framework 2.6
No suitable address space mapping found
Tried to open image as:
MachOAddressSpace: mac: need base
LimeAddressSpace: lime: need base
WindowsHiberFileSpace32: No base Address Space
WindowsCrashDumpSpace64BitMap: No base Address Space
WindowsCrashDumpSpace64: No base Address Space
...
IA32PagedMemory: Incompatible profile Win10x64 selected
OSXPmemELF: ELF Header signature invalid
FileAddressSpace: Must be first Address Space
ArmAddressSpace: No valid DTB found

As you can see, it was not successfully decompressed and is thus not usable.

Now, we will see what happens when we run plugins against the Hibernation Recon (HR) decompressed image…
$ python ~/volatility/vol.py -f Hibernated/Output/ActiveMemory.bin imageinfo
Volatility Foundation Volatility Framework 2.6
INFO : volatility.debug : Determining profile based on KDBG search...
Suggested Profile(s) : Win10x64_10586, Win10x64_14393, Win10x64, Win2016x64_14393
AS Layer1 : Win10AMD64PagedMemory (Kernel AS)
AS Layer2 : FileAddressSpace (/mnt/hgfs/G/Hibernation_Testing/Hibernated/Output/ActiveMemory.bin)
PAE type : No PAE
DTB : 0x1ab000L
KDBG : 0xf800a82f0500L
Number of Processors : 8
Image Type (Service Pack) : 0
KPCR for CPU 0 : 0xfffff800a8342000L
KPCR for CPU 1 : 0xffffda019e020000L
KPCR for CPU 2 : 0xffffda019e09b000L
KPCR for CPU 3 : 0xffffda019e116000L
KPCR for CPU 4 : 0xffffda019e193000L
KPCR for CPU 5 : 0xffffda019e1d2000L
KPCR for CPU 6 : 0xffffda019e291000L
KPCR for CPU 7 : 0xffffda019e310000L
KUSER_SHARED_DATA : 0xfffff78000000000L
Image date and time : 2017-03-08 02:12:21 UTC+0000
Image local date and time : 2017-03-07 18:12:21 -0800

$ python ~/volatility/vol.py -f Hibernated/Output/ActiveMemory.bin kdbgscan
...
**************************************************
Instantiating KDBG using: Unnamed AS Win10x64_14393 (6.4.14393 64bit)
Offset (V) : 0xf800a82f0500
Offset (P) : 0x469cf0500
KdCopyDataBlock (V) : 0xf800a81d0e00
Block encoded : Yes
Wait never : 0xd6dc0c37f24a0453
Wait always : 0x940ac90a25873204
KDBG owner tag check : True
Profile suggestion (KDBGHeader): Win10x64_14393
Service Pack (CmNtCSDVersion) : 0
Build string (NtBuildLab) : 14393.693.amd64fre.rs1_release.1
PsActiveProcessHead : 0xfffff800a82ff3d0 (39 processes)
PsLoadedModuleList : 0xfffff800a8305060 (189 modules)
KernelBase : 0xfffff800a8000000 (Matches MZ: True)
Major (OptionalHeader) : 10
Minor (OptionalHeader) : 0
KPCR : 0xfffff800a8342000 (CPU 0)
KPCR : 0xffffda019e020000 (CPU 1)
KPCR : 0xffffda019e09b000 (CPU 2)
KPCR : 0xffffda019e116000 (CPU 3)
KPCR : 0xffffda019e193000 (CPU 4)
KPCR : 0xffffda019e1d2000 (CPU 5)
KPCR : 0xffffda019e291000 (CPU 6)
KPCR : 0xffffda019e310000 (CPU 7)
**************************************************
...

Great. We’ve successfully retrieved the kdbg/dtb addresses along with the profile from the image. Now, let’s try to run some plugins against it to see what we’ve got…

$ python ~/volatility/vol.py -f Hibernated/Output/ActiveMemory.bin --kdbg=0xf800a81d0e00 --dtb=0x1ab000 --profile=Win10x64_14393 pslist
Volatility Foundation Volatility Framework 2.6
Offset(V) Name PID PPID Thds Hnds Sess Wow64 Start Exit
------------------ -------------------- ------ ------ ------ -------- ------ ------ ------------------------------ ------------------------------
0xffff9e04362eb6c0 System 4 0 209 0 ------ 0 2017-03-07 22:34:32 UTC+0000
0xffff9e043acbf800 smss.exe 372 4 4 0 ------ 0 2017-03-07 22:34:32 UTC+0000
0xffff9e043b4e9080 csrss.exe 540 528 13 -------- 0 0 2017-03-07 22:34:35 UTC+0000
0xffff9e043c439800 wininit.exe 628 528 4 0 0 0 2017-03-07 22:34:36 UTC+0000
0xffff9e043c4d8800 services.exe 708 628 33 -------- 0 0 2017-03-07 22:34:36 UTC+0000
0xffff9e043c540400 lsass.exe 752 628 11 -------- 0 0 2017-03-07 22:34:36 UTC+0000
0xffff9e043c4d4800 svchost.exe 872 708 54 0 0 0 2017-03-07 22:34:36 UTC+0000
0xffff9e043c4ce800 svchost.exe 936 708 16 0 0 0 2017-03-07 22:34:38 UTC+0000
0xffff9e043c472800 svchost.exe 348 708 104 -------- 0 0 2017-03-07 22:34:38 UTC+0000
0xffff9e043c626080 svchost.exe 388 708 54 0 0 0 2017-03-07 22:34:38 UTC+0000
0xffff9e043c683800 svchost.exe 1032 708 24 0 0 0 2017-03-07 22:34:38 UTC+0000
0xffff9e043c681800 svchost.exe 1096 708 32 -------- 0 0 2017-03-07 22:34:38 UTC+0000
0xffff9e043c67d800 svchost.exe 1212 708 38 0 0 0 2017-03-07 22:34:38 UTC+0000
0xffff9e043c67b800 svchost.exe 1236 708 34 0 0 0 2017-03-07 22:34:38 UTC+0000
0xffff9e043c66f800 nvvsvc.exe 1580 708 8 0 0 0 2017-03-07 22:34:38 UTC+0000
0xffff9e043c66b800 nvscpapisvr.ex 1588 708 7 0 0 0 2017-03-07 22:34:38 UTC+0000
0xffff9e043637d080 svchost.exe 2000 708 8 -------- 0 0 2017-03-07 22:34:38 UTC+0000
0xffff9e043ca1f800 svchost.exe 1292 708 12 0 0 0 2017-03-07 22:34:38 UTC+0000
0xffff9e043ca8b800 spoolsv.exe 2056 708 32 0 0 0 2017-03-07 22:34:38 UTC+0000
0xffff9e043c042700 sched.exe 2168 708 17 0 0 0 2017-03-07 22:34:38 UTC+0000
0xffff9e043c036800 avguard.exe 2428 708 120 0 0 0 2017-03-07 22:34:38 UTC+0000
0xffff9e043c032800 armsvc.exe 2440 708 5 0 0 0 2017-03-07 22:34:38 UTC+0000
0xffff9e043c034800 Avira.ServiceH 2448 708 31 -------- 0 0 2017-03-07 22:34:38 UTC+0000
0xffff9e043c030800 OfficeClickToR 2476 708 29 0 0 0 2017-03-07 22:34:38 UTC+0000
0xffff9e043c02e800 IPROSetMonitor 2508 708 4 0 0 0 2017-03-07 22:34:38 UTC+0000
0xffff9e043c02c800 LogiRegistrySe 2516 708 6 0 0 0 2017-03-07 22:34:38 UTC+0000
0xffff9e043c02a800 svchost.exe 2524 708 16 0 0 0 2017-03-07 22:34:38 UTC+0000
0xffff9e043c028800 NvNetworkServi 2544 708 5 0 0 0 2017-03-07 22:34:38 UTC+0000
0xffff9e043c026800 NvStreamServic 2680 708 11 0 0 0 2017-03-07 22:34:38 UTC+0000
0xffff9e043c024800 dasHost.exe 2740 1096 26 -------- 0 0 2017-03-07 22:34:38 UTC+0000
0xffff9e043be64740 svchost.exe 2760 708 19 -------- 0 0 2017-03-07 22:34:38 UTC+0000
0xffff9e043be66800 svchost.exe 2768 708 19 0 0 0 2017-03-07 22:34:38 UTC+0000
0xffff9e043be75800 vmnetdhcp.exe 2776 708 3 -------- 0 0 2017-03-07 22:34:38 UTC+0000
0xffff9e043be70800 vmware-usbarbi 2792 708 5 0 0 0 2017-03-07 22:34:38 UTC+0000
0xffff9e043be72800 vmnat.exe 2808 708 6 0 0 0 2017-03-07 22:34:38 UTC+0000
0xffff9e043be74800 vmware-authd.e 2824 708 7 0 0 0 2017-03-07 22:34:38 UTC+0000
0xffff9e043be91800 MsMpEng.exe 2836 708 8 0 0 0 2017-03-07 22:34:38 UTC+0000
0xffff9e043be97800 ss_conn_servic 2844 708 6 0 0 0 2017-03-07 22:34:38 UTC+0000
0xffff9e043beed040 MemCompression 2952 4 16 0 ------ 0 2017-03-07 22:34:38 UTC+0000

Excellent. Looks like many of the data structures are in tact to provide the types of information we’d expect from a full memory image!

So, let’s keep going…

$ python ~/volatility/vol.py -f Hibernated/Output/ActiveMemory.bin --kdbg=0xf800a81d0e00 --dtb=0x1ab000 --profile=Win10x64_14393 hivelist
Volatility Foundation Volatility Framework 2.6
Virtual Physical Name ------------------ ------------------ ----
0xffff87063f057000 0x00000000059f3000 \REGISTRY\MACHINE\HARDWARE

Uh oh, that doesn’t look right. There should be more hives found than that.

$ python ~/volatility/vol.py -f Hibernated/Output/ActiveMemory.bin --kdbg=0xf800a81d0e00 --dtb=0x1ab000 --profile=Win10x64_14393 userassist
Volatility Foundation Volatility Framework 2.6
The requested key could not be found in the hive(s) searched

No userassist (as it relies on the registry hives).

$ python ~/volatility/vol.py -f Hibernated/Output/ActiveMemory.bin --kdbg=0xf800a81d0e00 --dtb=0x1ab000 --profile=Win10x64_14393 shellbags
Volatility Foundation Volatility Framework 2.6
Scanning for registries....
Gathering shellbag items and building path tree...

And, no shellbags (as it also relies on the registry hives). So, I guess the decompressed image doesn’t contain that.

Well, how about files?

$ python ~/volatility/vol.py -f Hibernated/Output/ActiveMemory.bin --kdbg=0xf800a81d0e00 --dtb=0x1ab000 --profile=Win10x64_14393 filescan
Offset(P) #Ptr #Hnd Access Name ------------------ ------ ------ ------ ----
...
0x0000f000000f0820 3 0 RW-rwd \Device\HarddiskVolume2\$Extend\$RmMetadata\$Repair:$Corrupt:$DATA 0x0000f000000fe2d0 8 0 R--r-d \Device\HarddiskVolume6\Windows\System32\coreaudiopolicymanagerext.dll 0x0000f00000100420 12 0 R--r-d \Device\HarddiskVolume6\Windows\System32\Windows.UI.Xaml.Resources.dll 0x0000f00000100720 3 0 R--rwd \Device\HarddiskVolume6\Program Files\Microsoft Office\root\CLIPART\PUB60COR\NA02386_.WMF
0x0000f00000102ef0 15 0 R--r-d \Device\HarddiskVolume6\Windows\System32\dsreg.dll
0x0000f00000113080 32753 1 ------ \Device\DeviceApi\CMNotify
0x0000f000001132a0 15 0 R--rwd \Device\HarddiskVolume6\Windows\System32\vcruntime140.dll 0x0000f00000114cc0 15 0 R--r-d \Device\HarddiskVolume6\Windows\System32\microsoft-windows-kernel-power-events.dll
0x0000f0000011c370 32708 1 RW-r-- \Device\HarddiskVolume6\Windows\System32\winevt\Logs\Microsoft-Windows-AppXDeploymentServer%4Operational.evtx
0x0000f00000127ef0 16 0 R--r-d \Device\HarddiskVolume6\Windows\System32\DriverStore\FileRepository\iaahcic.inf_amd64_6c0fb3e072c6ec98\iaAHCIC.cat
0x0000f0000012e740 32768 1 ------ \Device\DeviceApi\CMNotify
0x0000f00000135a00 16 0 R--r-- \Device\HarddiskVolume6\Windows\INF\msgpiowin32.PNF
0x0000f00000140cd0 2 0 R--r-- \Device\HarddiskVolume6\Windows\WinSxS\Manifests\x86_microsoft.windows.i..utomation.proxystub_6595b64144ccf1df_1.0.14393.0_none_1e9c04c01886b354.manifest ...

Looks like that works, so mainly (in this short testing) we’re just missing registry hives.

While there are some anomalies here within strings (less identified ASCII and UNI strings in the decompressed hibernation file), we can see that not only does Hibernation Recon’s decompressed hibernation file yield substantially more artifacts across the board in both page_brute and Bulk_Extractor, but it also yields a memory image for use in/with Volatility. However, we can see that there are some pieces of missing information that would otherwise be resident in a memory image collected from a live system (namely registry hives as discovered in our testing, but there could be other missing items). Is Hibernation Recon missing resident information? Is Windows simply not storing that information in the hibernation file itself? I’m not certain, but would be very interested in finding out.

“Shutdown” System Results
See spreadsheet for Strings, Page_Brute, and Bulk_Extractor data.

Volatility
Attempt to convert/decompress native hibernation file to use with Volatility…
$ python ~/volatility/vol.py -f Shutdown/JPW10_hiberfil.sys --profile=Win10x64_14393 imagecopy -O Shutdown/Output/JPW10_hiberfil.sys_conv

Run pslist against the resulting file…
$ python ~/volatility/vol.py -f Shutdown/Output/JPW10_hiberfil.sys_conv --profile=Win10x64_14393 pslist

No results, showing the file wasn’t able to be successfully decompressed/parsed by Volatility.

So, let’s again move on to the HR decompressed file.

$ python ~/volatility/vol.py -f Shutdown/Output/ActiveMemory.bin imageinfo
Volatility Foundation Volatility Framework 2.6
INFO : volatility.debug : Determining profile based on KDBG search...
Suggested Profile(s) : Win10x64_14393, Win2016x64_14393
AS Layer1 : Win10AMD64PagedMemory (Kernel AS)
AS Layer2 : FileAddressSpace (/mnt/hgfs/G/Hibernation_Testing/Shutdown/Output/ActiveMemory.bin)
PAE type : No PAE
DTB : 0x1ab000L
KDBG : 0xf800a82f0500L
Number of Processors : 8
Image Type (Service Pack) : 0
KPCR for CPU 0 : 0xfffff800a8342000L
KPCR for CPU 1 : 0xffffda019e020000L
KPCR for CPU 2 : 0xffffda019e09b000L
KPCR for CPU 3 : 0xffffda019e116000L
KPCR for CPU 4 : 0xffffda019e193000L
KPCR for CPU 5 : 0xffffda019e1d2000L
KPCR for CPU 6 : 0xffffda019e291000L
KPCR for CPU 7 : 0xffffda019e310000L
KUSER_SHARED_DATA : 0xfffff78000000000L
Image date and time : 2017-03-07 22:39:53 UTC+0000
Image local date and time : 2017-03-07 14:39:53 -0800

$ python ~/volatility/vol.py -f Shutdown/Output/ActiveMemory.bin kdbgscan
Volatility Foundation Volatility Framework 2.6
**************************************************
Instantiating KDBG using: /mnt/hgfs/G/Hibernation_Testing/Shutdown/Output/ActiveMemory.bin WinXPSP2x86 (5.1.0 32bit)
Offset (P) : 0x3e0a9730
KDBG owner tag check : True
Profile suggestion (KDBGHeader): Win10x64_14393
PsActiveProcessHead : 0xa82ff3d0
PsLoadedModuleList : 0xa8305060
KernelBase : 0xfffff800a8000000
**************************************************
Instantiating KDBG using: /mnt/hgfs/G/Hibernation_Testing/Shutdown/Output/ActiveMemory.bin WinXPSP2x86 (5.1.0 32bit)
Offset (P) : 0x3e0a9730
KDBG owner tag check : True
Profile suggestion (KDBGHeader): Win2016x64_14393
PsActiveProcessHead : 0xa82ff3d0
PsLoadedModuleList : 0xa8305060
KernelBase : 0xfffff800a8000000

Again, we are able to successfully parse the HR decompressed image to get the initial offsets and profile needed to use Volatility and its plugins for analysis. So, let’s get to them.

$ python ~/volatility/vol.py -f Shutdown/Output/ActiveMemory.bin --kdbg=0xf800a81d0e00 --dtb=0x1ab000 --profile=Win10x64_14393 pslist
Volatility Foundation Volatility Framework 2.6
Offset(V) Name PID PPID Thds Hnds Sess Wow64 Start Exit
------------------ -------------------- ------ ------ ------ -------- ------ ------ ------------------------------ ------------------------------
0xffff9e04362eb6c0 System 4 0 206 0 ------ 0 2017-03-07 22:34:32 UTC+0000
0xffff9e043acbf800 smss.exe 372 4 4 0 ------ 0 2017-03-07 22:34:32 UTC+0000
0xffff9e043b4e9080 csrss.exe 540 528 14 -------- 0 0 2017-03-07 22:34:35 UTC+0000
0xffff9e043c439800 wininit.exe 628 528 7 0 0 0 2017-03-07 22:34:36 UTC+0000
0xffff9e043c4d8800 services.exe 708 628 33 -------- 0 0 2017-03-07 22:34:36 UTC+0000
0xffff9e043c540400 lsass.exe 752 628 9 -------- 0 0 2017-03-07 22:34:36 UTC+0000
0xffff9e043c4d4800 svchost.exe 872 708 46 0 0 0 2017-03-07 22:34:36 UTC+0000
0xffff9e043c4ce800 svchost.exe 936 708 14 0 0 0 2017-03-07 22:34:38 UTC+0000
0xffff9e043c472800 svchost.exe 348 708 96 -------- 0 0 2017-03-07 22:34:38 UTC+0000
0xffff9e043c626080 svchost.exe 388 708 53 0 0 0 2017-03-07 22:34:38 UTC+0000
0xffff9e043c683800 svchost.exe 1032 708 23 0 0 0 2017-03-07 22:34:38 UTC+0000
0xffff9e043c681800 svchost.exe 1096 708 24 -------- 0 0 2017-03-07 22:34:38 UTC+0000
0xffff9e043c67d800 svchost.exe 1212 708 31 0 0 0 2017-03-07 22:34:38 UTC+0000
0xffff9e043c67b800 svchost.exe 1236 708 30 0 0 0 2017-03-07 22:34:38 UTC+0000
0xffff9e043c66f800 nvvsvc.exe 1580 708 8 0 0 0 2017-03-07 22:34:38 UTC+0000
0xffff9e043c66b800 nvscpapisvr.ex 1588 708 7 0 0 0 2017-03-07 22:34:38 UTC+0000
0xffff9e043637d080 svchost.exe 2000 708 8 -------- 0 0 2017-03-07 22:34:38 UTC+0000
0xffff9e043ca1f800 svchost.exe 1292 708 12 0 0 0 2017-03-07 22:34:38 UTC+0000
0xffff9e043ca8b800 spoolsv.exe 2056 708 30 0 0 0 2017-03-07 22:34:38 UTC+0000
0xffff9e043c042700 sched.exe 2168 708 17 0 0 0 2017-03-07 22:34:38 UTC+0000
0xffff9e043c036800 avguard.exe 2428 708 120 0 0 0 2017-03-07 22:34:38 UTC+0000
0xffff9e043c032800 armsvc.exe 2440 708 5 0 0 0 2017-03-07 22:34:38 UTC+0000
0xffff9e043c034800 Avira.ServiceH 2448 708 28 -------- 0 0 2017-03-07 22:34:38 UTC+0000
0xffff9e043c030800 OfficeClickToR 2476 708 23 0 0 0 2017-03-07 22:34:38 UTC+0000
0xffff9e043c02e800 IPROSetMonitor 2508 708 4 0 0 0 2017-03-07 22:34:38 UTC+0000
0xffff9e043c02c800 LogiRegistrySe 2516 708 6 0 0 0 2017-03-07 22:34:38 UTC+0000
0xffff9e043c02a800 svchost.exe 2524 708 12 0 0 0 2017-03-07 22:34:38 UTC+0000
0xffff9e043c028800 NvNetworkServi 2544 708 5 0 0 0 2017-03-07 22:34:38 UTC+0000
0xffff9e043c026800 NvStreamServic 2680 708 10 0 0 0 2017-03-07 22:34:38 UTC+0000
0xffff9e043c024800 dasHost.exe 2740 1096 26 -------- 0 0 2017-03-07 22:34:38 UTC+0000
0xffff9e043be64740 svchost.exe 2760 708 17 -------- 0 0 2017-03-07 22:34:38 UTC+0000
0xffff9e043be66800 svchost.exe 2768 708 14 0 0 0 2017-03-07 22:34:38 UTC+0000
0xffff9e043be75800 vmnetdhcp.exe 2776 708 3 -------- 0 0 2017-03-07 22:34:38 UTC+0000
0xffff9e043be70800 vmware-usbarbi 2792 708 5 0 0 0 2017-03-07 22:34:38 UTC+0000
0xffff9e043be72800 vmnat.exe 2808 708 6 0 0 0 2017-03-07 22:34:38 UTC+0000
0xffff9e043be74800 vmware-authd.e 2824 708 7 0 0 0 2017-03-07 22:34:38 UTC+0000
0xffff9e043be91800 MsMpEng.exe 2836 708 8 0 0 0 2017-03-07 22:34:38 UTC+0000
0xffff9e043be97800 ss_conn_servic 2844 708 6 0 0 0 2017-03-07 22:34:38 UTC+0000
0xffff9e043beed040 MemCompression 2952 4 4 0 ------ 0 2017-03-07 22:34:38 UTC+0000

Great. Again, looks like we have a memory image here that we can successfully use with Volatility.

$ python ~/volatility/vol.py -f Hibernated/Output/ActiveMemory.bin --kdbg=0xf800a81d0e00 --profile=Win10x64_14393 hivelist
Volatility Foundation Volatility Framework 2.6
Virtual Physical Name ------------------ ------------------ ----
0xffff87063f057000 0x00000000059f3000 \REGISTRY\MACHINE\HARDWARE

Uh oh (again). It can’t seem to locate many of the registry hives in memory.

$ python ~/volatility/vol.py -f Hibernated/Output/ActiveMemory.bin --kdbg=0xf800a81d0e00 --profile=Win10x64_14393 userassist
Volatility Foundation Volatility Framework 2.6
The requested key could not be found in the hive(s) searched

$ python ~/volatility/vol.py -f Hibernated/Output/ActiveMemory.bin --kdbg=0xf800a81d0e00 --profile=Win10x64_14393 shellbags
Volatility Foundation Volatility Framework 2.6
Scanning for registries....
Gathering shellbag items and building path tree...

$ python ~/volatility/vol.py -f Hibernated/Output/ActiveMemory.bin --kdbg=0xf800a81d0e00 --profile=Win10x64_14393 shimcache
Volatility Foundation Volatility Framework 2.6
WARNING : volatility.debug : No ShimCache data found

Again, can’t extract the info from these plugins because of the lack of registry hives found.

However, it seems that many other plugins complete successfully.

$ python ~/volatility/vol.py -f Hibernated/Output/ActiveMemory.bin --kdbg=0xf800a81d0e00 --profile=Win10x64_14393 filescan
Volatility Foundation Volatility Framework 2.6
Offset(P) #Ptr #Hnd Access Name ------------------ ------ ------ ------ ----
...
0x0000f000000f0820 3 0 RW-rwd \Device\HarddiskVolume2\$Extend\$RmMetadata\$Repair:$Corrupt:$DATA 0x0000f000000fe2d0 8 0 R--r-d \Device\HarddiskVolume6\Windows\System32\coreaudiopolicymanagerext.dll 0x0000f00000100420 12 0 R--r-d \Device\HarddiskVolume6\Windows\System32\Windows.UI.Xaml.Resources.dll 0x0000f00000100720 3 0 R--rwd \Device\HarddiskVolume6\Program Files\Microsoft Office\root\CLIPART\PUB60COR\NA02386_.WMF
0x0000f00000102ef0 15 0 R--r-d \Device\HarddiskVolume6\Windows\System32\dsreg.dll
0x0000f00000113080 32753 1 ------ \Device\DeviceApi\CMNotify
0x0000f000001132a0 15 0 R--rwd \Device\HarddiskVolume6\Windows\System32\vcruntime140.dll 0x0000f00000114cc0 15 0 R--r-d \Device\HarddiskVolume6\Windows\System32\microsoft-windows-kernel-power-events.dll
0x0000f0000011c370 32708 1 RW-r-- \Device\HarddiskVolume6\Windows\System32\winevt\Logs\Microsoft-Windows-AppXDeploymentServer%4Operational.evtx
0x0000f00000127ef0 16 0 R--r-d \Device\HarddiskVolume6\Windows\System32\DriverStore\FileRepository\iaahcic.inf_amd64_6c0fb3e072c6ec98\iaAHCIC.cat
0x0000f0000012e740 32768 1 ------ \Device\DeviceApi\CMNotify
0x0000f00000135a00 16 0 R--r-- \Device\HarddiskVolume6\Windows\INF\msgpiowin32.PNF
0x0000f00000140cd0 2 0 R--r-- \Device\HarddiskVolume6\Windows\WinSxS\Manifests\x86_microsoft.windows.i..utomation.proxystub_6595b64144ccf1df_1.0.14393.0_none_1e9c04c01886b354.manifest
...

I also ran the mbrparser and mftparser plugins against the image to see if that data was resident.

$ python ~/volatility/vol.py -f Hibernated/Output/ActiveMemory.bin --kdbg=0xf800a81d0e00 --profile=Win10x64_14393 mbrparser

Verified works.

$ python ~/volatility/vol.py -f Hibernated/Output/ActiveMemory.bin --kdbg=0xf800a81d0e00 --profile=Win10x64_14393 mftparser

Verified works.

So, we seem to witness the same anomaly in strings, however it appears that the decompressed hibernation file contains more identified Unicode strings as compared to the native file. Given that strings performs a relatively arbitrary function (i.e. identify things that might be strings of an alphabet/namespace), I am simply providing it as a data point. And, again, we see that the decompressed file yields a substantial amount of additional information that was otherwise obfuscated/hidden from discovery in its native form.

Conclusion

As you can see, Arsenal’s tool was able to successfully decompress and reconstruct the provided Hibernation files (sans the zeroed file from the Booted system obviously), thus restoring a substantial amount of otherwise obfuscated/encoded data and ultimately our capability to extract useful artifacts in our investigations! Given how long it’s been since I’ve been able to easily and comprehensively decompress a Windows 8/Server 2012+ Hibernation file, I would have been satisfied with simple decompression of all strings or chunks of data. Not only do we get that, but also the restored ability to use Volatility for more comprehensive analysis of the extracted memory image (sans a few missing memory artifacts as previously noted*).

For me, it looks like I now have a new go-to tool for decompressing Hibernation files from Windows 8/Server 2012+ systems.

*If anyone has any insight, I would love to find out why we can’t seem to locate the registry hives in the reconstructed memory image, along with what else may be missing (as I didn’t test every single plugin) and why.

/JP

Quick(er) Mounting and Dismounting of LVM’s on Forensic Images

I recently came across Int’l Man of Leisure’s blog posts here and here on “Mounting and Imaging Logical Volume Manager (LVM2)”. He does a great job of defining the problem statement (dealing with LVM’s in their various image formats in a DFIR investigation) and how to work through getting a set of logical images back into their intended LVM layout for appropriate mounting and analysis.

IMOL begins by going through the background of LVM, what it is, and how to install it to prepare your system for dealing with LVM’s. Once prepared, IMOL begins by presenting a set of two VMDK images that must be merged or “stitched together” in order to be interpreted and parsed by the Linux LVM. However, VMDK files are not something natively readable/mountable by a linux system. So, before we can even begin stitching these back together, these VMDK files must be converted into something natively readable by the system, such as a raw image/block device. In IMOL’s testing, he found that FTK Imager was one of a few tools that was able to read the VMDK files in order to convert (image) them to raw files. He then used FTK Imager to image the VMDK files into respective Raw DD format files for continued use. However, here is where I would like to branch into my process for mounting LVM’s that completely eliminates the need for converting an image to raw using a tool called “QEMU”, and thus saving you (potentially) hours of time.

We all know when dealing with forensic imaging/conversion that even the slightest hiccup can render an entire image useless and long-spent time wasted. The less time we spend imaging/converting, the faster we can get to analysis and toward our goals for the investigation. Enter QEMU, specifically “qemu-nbd”. I could go into a lot of detail of all the types of images it can convert and how useful it can be in various capacities (in fact, I may do another blog post about it). However, for this post, I will just stick to specifically how you can use it to perform on-the-fly image format translation (in real-time) between various formats – no need to spend time converting to another image file.

QEMU has a utility called “qemu-nbd” (nbd stands for Network Block Device) that essentially performs real-time translation betwixt (I have waited so long to use that word in a serious tone) various image formats. It’s as easy as the following:

Ensure you have an available NBD
# ls -l /dev/nbd*

If no device files (or not enough) exist as /dev/nbd*, create as many as needed
# for i in {0..<z>}; do mknod /dev/nbd$i b 43 $i; done
*Where <z> is the number of devices you need, minus one

Mount the image file
# qemu-nbd -r -c /dev/nbd<x> image.<extension>
* -r: read-only
* -c: connect image file to NBD device
*Where <x> is the appropriate block device number (typically starting at 0) and <extension> is a supported QEMU Image Type (raw, cloop, cow, qcow, qcow2, vmdk, vdi, vhdx, vpc)

Note that this will need to be done for each image that is a part of the LV group. For example, if there are 3 different VMDK files that together comprise one or more LV groups, you would do the following (ensuring the associated /dev/nbd devices have already been created before issuing the below commands):

# qemu-nbd -r -c /dev/nbd0 image_0.vmdk
# qemu-nbd -r -c /dev/nbd1 image_1.vmdk
# qemu-nbd -r -c /dev/nbd2 image_2.vmdk

That’s it. Each /dev/nbd<x> is immediately translated and available as a raw block device to be queried/mounted just as if it were a raw image to begin with. Pretty awesome, huh?

Now, if you were lucky enough to start with raw/DD images, you don’t need to perform any of the above. Instead, you can just skip to the below instructions for mounting and mapping the LVM’s.

At this point, my process to identify and load the LVM(s) mostly mirrors that as described by IMOL, with a few subtle differences. I won’t go into great detail of it all as IMOL gives great descriptions of each step in his walk-through. However, I will lay out my commands below for those who are looking for an easy copy/paste method to stick into their cheat sheets.

Keep in mind that the order of the below commands is critical to successful mounting of LVM’s.

Load the LVM module if not already loaded
# modprobe dm_mod

Ensure you have enough available loopback devices (one for each nbd device)
# ls -l /dev/loop*

If not enough loopback devices exist, create as many as needed
# for i in {0..<z>}; do mknod /dev/loop$i b 7 $i; done
*Where <z> is the number of devices you need, minus one

Set up a loopback device for each image that is part of the LV group
# losetup -r [-o <byte_offset>] -f [/dev/loop<x>] /dev/nbd<x>

Read partition tables from each loopback device to create mappings
# kpartx -a -v /dev/loop<x>

List the available Physical Volume Groups (VG’s)
# pvdisplay

List the available Logical Volume Groups (VG’s)
# lvdisplay

(Optional) If not listed, re-scan the mounted volumes to identify the associated VG’s
# pvscan
# lvscan
# vgscan

Activate the appropriate VG’s
# vgchange -a y <VG>
** The recombined LVM volume(s) will now be available at /dev/mapper/<VolumeGroup>-<VolumeName>

Mount the LVM Volume(s)
# mount [options] /dev/mapper/<VolumeGroup>-<VolumeName> /mnt/point

Congratulations. You (should) now have filesystem access to the given LVM(s)!

== Sidebar ==

Interested in why we use the given numbers of “43” and “7” for the mknod command?

The mknod command is structured like the following: mknod <device> <type> <major_#> <minor_#>

For our uses, we are creating device files of type “b” (block device), with major #’s of “43” (nbd) and “7” (loopback). The major number tells the system what type of device to expect and operate as. For a list of devices that your system is aware of and can dynamically assign when a major number is not specified, check out your /proc/devices file. IBM does a rather good job of explaining it all here. The minor number is more for reference and thus should probably, as best practice, reference/relate to the device number as well. Though, there is nothing requiring it to be that way.

For further information about the mknod command structure, just check out the man page.

== /Sidebar ==

Once you’re done with the images, the next logical step is to dismount the images which can at times become unnecessarily and illogically troublesome. To properly dismount LVM’s, perform the following steps (again, order is critical here!):

Dismount each mounted filesystem
# umount /mnt/point

De-activate each activated Volume Group
# vgchange -a n <VG>

Remove partition mappings for each loop device
# kpartx -d -v /dev/loop<x>

Remove each loopback device
# losetup -d /dev/loop<x>

(Optional) Force remove an LVM
# dmsetup remove -f <VG>

Keep in mind the dmsetup command above is considered deprecated and not suggested for use. However, I provide it as I have had to use it at times in the past when a VG simply would not detach using the appropriate commands. That said, if all else fails, reboot 🙂

Hopefully, this post will help with the often convoluted process of mounting LVM’s, especially when split across multiple images/devices.

/JP

OSX (Mac) Memory Acquisition and Analysis Using OSXpmem and Volatility

Macs don’t get much love in the forensics community, aside from @iamevltwin (Sarah Edwards), @patrickolsen (Patrick Olsen), @patrickwardle (Patrick Wardle), and a few other incredibly awesome pioneers in the field. We see blog posts all the time about Windows forensics and malware analysis techniques, along with some Linux forensic analysis, but rarely do we see any posts about Mac technical/forensic analysis or techniques. I find this odd, considering the surge in usage and deployment over the last several years, particularly within enterprises. Well, with my most recent two part Mac post as well as this one, I’m attempting to change this, my friends!

Macs need love and disk/memory analysis as well, amirite?

Let’s have a look at memory acquisition of OSX systems using a nifty tool called OSXpmem.

OSXpmem is a part of the pmem suite created by the developers of Rekall. Rekall itself is actually a very useful utility built for both memory acquisition and live memory analysis on Windows, Linux, and OSX systems. While I will be delving into Rekall in a future post, for this we will simply be focusing on OSXpmem, which is an awesome command-line utility for quickly and easily collecting RAM from a Mac system. One of its greatest features is its output to an AFF4 volume, which has a ton of useful features (likely to be discussed in a dedicated post in the future as well).

Acquiring Memory

So, what’s the easiest way to get up and running with the tool for memory acquisition?

  1. Download latest release (as of this post, the latest osxpmem release is “2.1.post4”).
  2. Unzip the package
    1. $ unzip osxpmem.osxpmem-2.1.post4.zip
  3. Run it to collect memory from the local system
    1. $ ./osxpmem.app/osxpmem -o <output_dir>

Super simple, right?

Wellll, maybe not that simple. When you run it, even as sudo/root, you may get the following error:

$ sudo osxpmem.app/osxpmem -o Memory_Captures/mem.aff4
Imaging memory
E1229 15:17:26.335978 3375588288 aff4_file.cc:289] Can not open file /dev/pmem :No such file or directory
/Users/jp/Projects/osxpmem.app/MacPmem.kext failed to load - (libkern/kext) authentication failure (file ownership/permissions); check the system/kernel logs for errors or try kextutil(8).
E1229 15:17:26.606639 3375588288 osxpmem.cc:283] Unable to load driver at /Users/jp/Projects/osxpmem.app/MacPmem.kext
E1229 15:17:26.606714 3375588288 pmem_imager.cc:328] Imaging failed with error: -8

How usefully nondescript. Let me save you some time, as searching the system/kernel logs as suggested yields nothing useful.

So, instead, let’s use the native utility kextutil’s “test” parameter (-t) to see if that gets us anywhere…

$ sudo kextutil -t osxpmem.app/MacPmem.kext/
Diagnostics for osxpmem.app/MacPmem.kext:
Authentication Failures:
File owner/permissions are incorrect (must be root:wheel, nonwritable by group/other):
osxpmem.app/MacPmem.kext
Contents
_CodeSignature
CodeResources
Info.plist
MacOS
MacPmem

Nice. It finally tells us what’s wrong. The file ownership/permissions must be changed to “root:wheel”. Easy enough…

$ sudo chown -R root:wheel osxpmem.app/

So, let’s try again…

$ sudo osxpmem.app/osxpmem -o Memory_Captures/mem.aff4
Imaging memory
Creating output AFF4 ZipFile.
Reading 0x8000 0MiB / 8095MiB 0MiB/s
Reading 0xe38000 14MiB / 8095MiB 56MiB/s
Reading 0x1c88000 28MiB / 8095MiB 56MiB/s
Reading 0x2ac0000 42MiB / 8095MiB 56MiB/s
Reading 0x3978000 57MiB / 8095MiB 58MiB/s
Reading 0x47c8000 71MiB / 8095MiB 56MiB/s
Reading 0x5678000 86MiB / 8095MiB 58MiB/s
Reading 0x6500000 101MiB / 8095MiB 57MiB/s

Reading 0x1f7478000 8052MiB / 8095MiB 39MiB/s
Reading 0x1f7d68000 8061MiB / 8095MiB 35MiB/s
Reading 0x1f8708000 8071MiB / 8095MiB 38MiB/s
Reading 0x1f9150000 8081MiB / 8095MiB 41MiB/s
Reading 0x1f9c00000 8092MiB / 8095MiB 41MiB/s

YES! It worked! As you can see, my system has 8GB of memory that was (by default) exported to an AFF4 volume/file called “mem.aff4”.

You also have the option to include additional local files within the resulting AFF4 volume/file via the “-i </path/to/file> -i </path/to/file> …” command line option(s), which can be useful in producing a singular output volume containing not only memory but other files (binaries/logs/etc.) you’d like to analyze as well. In the past, I used this option to collect the local /bin/bash file when Volatility used to require the bash shell’s memory address be provided in order to parse command history and produce associated timestamps when using the linux_bash plugin. Though the documentation still shows it as a requirement, it’s actually not needed anymore and parses it all just fine.

In addition, you may also export the memory image to a singular RAW or ELF file by using the “–format elf” or “–format raw” command line options if that suits your fancy. However, for this post, I am using the default AFF4 output so that we may explore its use and features a bit.

So, without further ado, let’s take a look at the resulting AFF4 volume/file.

$ sudo osxpmem.app/osxpmem -V Memory_Captures/mem.aff4
Password:
@prefix rdf: <http://www.w3.org/1999/02/22-rdf-syntax-ns#> .
@prefix aff4: <http://aff4.org/Schema#> .
@prefix xsd: <http://www.w3.org/2001/XMLSchema#> .
@prefix memory: <http://aff4.org/Schema#memory/> .
<aff4://7f482355-5683-46bb-87c0-21afd75dbbeb/dev/pmem>
aff4:category memory:physical ;
aff4:stored <aff4://7f482355-5683-46bb-87c0-21afd75dbbeb> ;
a aff4:map .
<aff4://7f482355-5683-46bb-87c0-21afd75dbbeb/dev/pmem/data>
aff4:chunk_size 32768 ;
aff4:chunks_per_segment 1024 ;
aff4:compression <https://www.ietf.org/rfc/rfc1950.txt> ;
aff4:size 8488656896 ;
aff4:stored <aff4://7f482355-5683-46bb-87c0-21afd75dbbeb> ;
a aff4:image .
Objects in use:
Objects in cache:
aff4://7f482355-5683-46bb-87c0-21afd75dbbeb - 0
aff4://7f482355-5683-46bb-87c0-21afd75dbbeb/information.turtle - 0
file:///Users/jp/Projects/Memory_Captures/mem.aff4 - 0

Here, you can see that we extracted a memory image to the AFF4 stream “7f482355-5683-46bb-87c0-21afd75dbbeb/dev/pmem“.

Now, what can we do with this? Well, one thing you could do (if not using Rekall to analyze this image) might be to extract the AFF4 memory image stream into a singular raw file for parsing/analysis by other tools such as Volatility, page_brute, yara, strings, etc. To do that, we perform the following:

$ sudo osxpmem.app/osxpmem -e /dev/pmem -o Memory_Captures/mem.raw Memory_Captures/mem.aff4
Extracting aff4://7f482355-5683-46bb-87c0-21afd75dbbeb/dev/pmem into file:///Users/jp/Projects/Memory_Captures/mem.raw
Reading 0x8000 0MiB / 9968MiB 0MiB/s
Reading 0x750000 7MiB / 9968MiB 28MiB/s
Reading 0xde0000 13MiB / 9968MiB 25MiB/s
Reading 0x1480000 20MiB / 9968MiB 25MiB/s

Reading 0x26d938000 9945MiB / 9968MiB 21MiB/s
Reading 0x26deb8000 9950MiB / 9968MiB 21MiB/s
Reading 0x26e418000 9956MiB / 9968MiB 20MiB/s
Reading 0x26eab0000 9962MiB / 9968MiB 25MiB/s

$ ls -l Memory_Captures/
total 25665056
-rwxr-xr-x 1 root staff 2688302741 Dec 29 15:30 mem.aff4
-rwxr-xr-x 1 root staff 10452205568 Dec 29 16:10 mem.raw

As you can see, the raw image is uncompressed and thus substantially larger than the AFF4 volume (one of the useful features of AFF4 is its compression options). Nonetheless, there you have it. A raw memory image to parse to your heart’s content with whatever tools you like.

However, before we move on, I personally like to unload the kernel extension for one last good measure so that it’s not just hanging out there for no purpose.

$ sudo osxpmem.app/osxpmem -u
Unloading driver /Users/jp/Projects/osxpmem.app/MacPmem.kext

Creating a Memory Profile

**Update 11/2019**

The dwarfdump conversion process using Volatility’s convert.py utility is broken for any recent version of OSX/MacOS. If you try to perform it, you will likely get a “State machine broken! level 0!” error stemming from this area in the convert.py code. I am unaware of any current fix for this as it appears the Volatility team is focusing all their efforts in the Volatility 3 build.

——

Acquiring a memory image is great, but unfortunately is useless (with respect to Volatility) without the appropriate profile to parse it. Volatility requires a memory profile be specified when parsing a memory image via the “–profile=<profile>” command line option. By default, Volatility includes a ton of profiles for Windows, but such is not the case for Linux and Mac. Though a profiles repository has been created containing a substantial set of profiles for Linux and Mac, YMMV. In my situation, I’m running the latest MacOS Sierra release 10.12.3, for which no profile existed as of this post (nor did it for 10.12.2 until I created and submitted one to the repo as well :D). Therefore, I had to create my own profile. Luckily, the folks at Volatility do a great job walking us through building a profile on a Mac. Though, there are a few clarifications I’d like to address.

To begin, I need to provide some clarification/correction for the initial step, focusing on the part in italics:

“To create a profile, you first need to download the KernelDebugKit for the kernel you want to analyze. This can be downloaded from the Apple Developer’s website (click OS X Kernel Debug Kits on the right). This account is free and only requires a valid Email address.

After the DebugKit is downloaded, mount the dmg file. This will place the contents at “/Volumes/KernelDebugKit”.”

While the above statement is true, if you immediately dismount a package once it’s installed like I do, you should instead pay attention to the installer to see where it is putting the files for long term access. Independent of the mounted package, the KDK is installed in the following location, which will need to be referenced for future use once the package is dismounted post-install:

/Library/Developer/KDKs/KDK_<version>.kdk/

As of current, for macOS Sierra 10.12.2 and 10.12.3, the <version> will be “10.12.2_16C67” and “KDK_10.12.3_16D32.kdk“, respectively.

/Library/Developer/KDKs/KDK_10.12.2_16C67.kdk/
/Library/Developer/KDKs/KDK_10.12.3_16D32.kdk/

Thus, “Step 1” for building a 10.12.3 profile would be the following (for a 64-bit 10.12.3 system):

$ dwarfdump -arch x86_64 /Library/Developer/KDKs/KDK_10.12.3_16D32.kdk/System/Library/Kernels/kernel.dSYM > 10.12.3_x64.dwarfdump

Also note that the referenced kernel file names vary from the current instructions (e.g., “mach_kernel.dSYM” is now “kernel.dSYM”, and “mach_kernel” is now just “kernel”). So, do exercise additional caution when running the commands. For ease of reference, below should be the locations for both of these files on a macOS Sierra 10.12.3 64-bit system (but note that this may change with future versions):

/Library/Developer/KDKs/KDK_10.12.3_16D32.kdk/System/Library/Kernels/kernel
/Library/Developer/KDKs/KDK_10.12.3_16D32.kdk/System/Library/Kernels/kernel.dSYM

All of the above is actually noted during the install as well:

To save everyone a bit of time and translation from current Volatility documentation, I’ve written out the latest required steps below for relatively easy copy/paste into your terminal. For this, we are using the latest 10.12.3 release and associated KDK as an example:

  1. Check to see if a profile is already available for your particular OSX version/release
    1. https://github.com/volatilityfoundation/profiles/tree/master/Mac
  2. If not, download and install the KDK appropriate for your current (or targeted) OSX version/release
    1. http://developer.apple.com/hardwaredrivers
  3. Get the dwarf debug info from the kernel.
    1. $ dwarfdump -arch x86_64 /Library/Developer/KDKs/KDK_10.12.3_16D32.kdk/System/Library/Kernels/kernel.dSYM > 10.12.3_x64.dwarfdump
  4. Convert the dwarfdump output to Linux style output readable by Volatility
    1. $ python tools/mac/convert.py 10.12.3_x64.dwarfdump converted-10.12.3_x64.dwarfdump
  5. Create the types from the converted file
    1. $ python tools/mac/convert.py converted-10.12.3_x64.dwarfdump > 10.12.3.64bit.vtypes
  6. Generate symbol information
    1. $ dsymutil -s -arch x86_64 /Library/Developer/KDKs/KDK_10.12.3_16D32.kdk/System/Library/Kernels/kernel > 10.12.3.64bit.symbol.dsymutil
  7. Create a zip file of the *.dsymutil and *.vtypes files
    1. $ zip 10.12.3.64bit.zip 10.12.3.64bit.symbol.dsymutil 10.12.3.64bit.vtypes
    2. **See note at end of instructions**
  8. Copy the zip file to to the volatility/plugins/overlays/mac/ directory (remember, we are already inside the root /volatility directory)
    1. $ cp 10.12.3.64bit.zip volatility/plugins/overlays/mac/
  9. Verify your profile is registered and ready for use
    1. $ python vol.py --info | grep "A Profile for Mac"
      1. The profile name presented is the string you will pass to the “–profile=” parameter when analyzing a memory image from this version/release in Volatility

**Note: While I append “x64” or “64bit” to my various output files to keep track of which architecture build I’m producing, doing so for the final .zip output file yields profile names with rather weird-looking duplicate 64-bit identifiers (e.g., “Mac10_12_3_64bitx64”). If you would like cleaner looking profile names (at the cost of losing the filename identifier denoting the arch build), you should instead drop the trailing identifier and provide a name the file like the following “10.12.3.zip”, thus yielding a prettier (IMO) profile name like “Mac10_12_3x64”.

Using Volatility for Analysis

Once we have successfully created the appropriate profile for the acquired image, we can now use the plethora of native Volatility Mac OSX plugins provided to us for analysis.

To see the list of available plugins, simply type the following:

#Executed from within the root /volatility folder of a git cloned repo
$ python vol.py --info | grep "mac_"

#Using the standalone binary
$ ./volatility_2.6_mac64_standalone --info | grep "mac_"

Conclusion

That pretty much wraps it up for this post. There is certainly more to explore with OSXpmem, the AFF4 format, and Volatility. However, I encourage you to explore it on your own as I would like to save some feature exploration for future in-depth posts focused on using both Volatility and the Rekall suite.

/JP

Mac Dumpster Diving – Identifying Deleted File References in the Trash (.DS_Store) Files – Part 2

In Part 1 of this post, we identified where these artifacts reside along with options for parsing them. However, we still have not addressed why/how this anomaly occurs. Thus, in Part 2 of this post, we must now test to see how/why this occurs.

The behavior we’re seeing led me to the following hypothesis for testing:

  1. Although the .DS_Store file is “deleted”, when it is re-created it is created in the same space on disk within the same previously allocated blocks on the volume.
    1. *Note: This same situation often occurs on Windows when event logs are cleared/deleted and the event log file is re-created. The re-created log file often inhabits an area on disk surrounding previously deleted entries that may or may not be relevant to the current log at hand. Thus, carving of that file for entries can yield various event entries.
  2. The .DS_Store entries are stored somewhere else on disk and/or memory and are referenced and re-populated within the file upon re-creation for some reason (what reason, I have no idea).
  3. …or another theory that might make sense. (Please share your hypothesis or factual knowledge!)

I tested #1 above by using the “stat” command to see if a deleted and then re-created .DS_Store file would occupy the same inode and it does not. However, I still leave room for the possibility that even though a new inode is associated with the file each time it is re-created, it may still be somehow occupying (some of) the same space on disk.

I tested the on-disk aspect of #2 by searching across all files on disk for any references to a file that was previously deleted (since reboot) – the installer for BlockBlock named “BlockBlock_Installer.app”. The following files stood out to me:

$ sudo sift -z -a -l --err-skip-line-length BlockBlock_Installer.app /
...
/private/var/audit/20161217022600.crash_recovery
/private/var/db/uuidtext/AC/AF78F7097534A2A72631F3DD0AFE52
/private/var/folders/q4/r796r6tx2sd7zhjsxn2bjmv00000gn/0/com.apple.LaunchServices-175-v2.csstore
/private/var/folders/zz/zyxvpxvq6csfxvn_n0000000000000/0/com.apple.LaunchServices-175-v2.csstore
/.Spotlight-V100/Store-V2/3AF86A9A-8A7B-414A-8479-E5FACBC49DF1/Cache/0000/0000/000f/997405.txt
...

While each of the above files did contain references to the given file name, none of them contained anything relevant to our research here to indicate they were the culprit of our .DS_Store file entry repopulation issue.

As an aside, the last entry was actually the Spotlight indexed (cached) Evernote page I have been using to take notes for this research 🙂 Do note that the Spotlight database and cache directories are also great places to search for references to deleted files as well, to possibly include full content that has been cached by indexing.

Moving on, I then tested the in-memory aspect of #2 by capturing a memory image (will author a separate blog post on doing this later) from my system and using Volatility’s yarascan and strings plugins to identify where in memory these entries may reside. I debated just showing the end results here, but I figure there is merit in showing how I got to the results as well. So, bonus for everyone!

Volatility’s yarascan plugin (specifically, mac_yarascan for our use on a Mac image) takes a yara rules file, finds matches across a memory image with the associated files/processes/memory areas, and (optionally) dumps the resulting files for analysis. So, this would seem rather useful for our situation here in trying to identify where in memory the historical deleted file references currently exist. To begin, I created the following yara rules file containing references to files that have been deleted from my system but whose entries still remain in the .Trash./DS_Store file.

rule ds_store_searches
{
strings:
$s1=”BlockBlock_Installer.app”
$s2=”canon-mx920-19_1_0a-ea11.dmg”
$s3=”FileZilla-Installer.app”
$s4=”SpotifyInstaller.zip”

condition:
any of them
}

As you can see, I’ve installed a few programs recently, the packages of which I deleted upon successful installation. However, these entries continue to be re-populated back into the .Trash/.DS_Store file on my system as I have not rebooted since I deleted them.

Using the latest release (2.6) of Volatility’s standalone OSX executable along with a custom macOS Sierra 10.12.2 profile I manually generated (and is now available in the Mac profiles repository for all to use!), I scanned the memory image for references to the above files using the mac_yarascan plugin as shown below.

$ ./volatility_2.6_mac64_standalone --plugins=/Users/jp/Projects/volatility/volatility/plugins/ --profile=Mac10_12_2_x64x64 -f ~/Projects/Memory_Captures/mem.raw mac_yarascan -A -y ~/Projects/Yara/ds_store.yar

I’m not going to lie to you, this ran for the better part of a day on my 2015 Core i5 MBA against an 8GB memory image. So, don’t expect speedy results from running this plugin.

=== Begin Sidebar ===

In comparison to the above, running Yara against the image took just under 3 minutes. However, the two tools are doing different things (to an extent) and producing different results.

Yara simply scanned the image and output the location(s) within memory where each hit was identified:

$ yara -s -p 8 ~/Projects/Yara/ds_store.yar mem.raw
0x1fd2cb6:$s1: BlockBlock_Installer.app
0xd380f26:$s1: BlockBlock_Installer.app
0x27b8d40c:$s1: BlockBlock_Installer.app
0x45dbd248:$s1: BlockBlock_Installer.app
0x46fa6195:$s1: BlockBlock_Installer.app

0x17efc11:$s2: canon-mx920-19_1_0a-ea11.dmg
0x1908620:$s2: canon-mx920-19_1_0a-ea11.dmg
0xd11f441:$s2: canon-mx920-19_1_0a-ea11.dmg
0x1831f101:$s2: canon-mx920-19_1_0a-ea11.dmg
0x42748dd1:$s2: canon-mx920-19_1_0a-ea11.dmg

0x1fd2c26:$s3: FileZilla-Installer.app
0x4dbb356:$s3: FileZilla-Installer.app
0x5c208e5:$s3: FileZilla-Installer.app
0x141bbf81:$s3: FileZilla-Installer.app
0x22be06cc:$s3: FileZilla-Installer.app
...
0x1fd22c6:$s4: SpotifyInstaller.zip
0xc5030c6:$s4: SpotifyInstaller.zip
0x41c95ee6:$s4: SpotifyInstaller.zip
0x54c9c5d9:$s4: SpotifyInstaller.zip
0x54c9c5f6:$s4: SpotifyInstaller.zip

These hits can be verified and further investigated by hexdump:

$ hexdump -C -s 0x1fd2cb6 -n 100 mem.raw
01fd2cb6 42 6c 6f 63 6b 42 6c 6f 63 6b 5f 49 6e 73 74 61 |BlockBlock_Insta|
01fd2cc6 6c 6c 65 72 2e 61 70 70 20 0a ad be b5 29 2e a8 |ller.app ....)..|
01fd2cd6 dd ba 80 f9 45 00 00 60 00 00 00 00 00 00 00 00 |....E..`........|
01fd2ce6 00 00 00 00 00 00 00 00 00 00 a4 fa ef 3d 33 33 |.............=33|
01fd2cf6 eb 3f 00 00 00 00 00 00 00 00 08 00 00 00 00 00 |.?..............|
01fd2d06 00 00 40 04 00 00 00 00 00 00 1b 04 00 00 00 00 |..@.............|
01fd2d16 00 00 00 98 |....|

While this is great and shows us that these historical references exist across a ton of areas within memory, it doesn’t really help us identify any useful context. Nonetheless, Yara is an incredibly useful tool that has a variety of purposes, so it’s just a matter of knowing your tools and which one you need to do a given job.

=== End Sidebar ===

Volatility’s mac_yarascan output provided a lot of useful results with context. Just what we needed! Below is a sample entry:

Task: lsd pid 230 rule ds_store_searches addr 0x10c0462bc
0x000000010c0462bc 46 69 6c 65 5a 69 6c 6c 61 2d 49 6e 73 74 61 6c FileZilla-Instal
0x000000010c0462cc 6c 65 72 2e 61 70 70 00 39 31 30 2e 2f 56 6f 6c ler.app.910./Vol
0x000000010c0462dc 75 6d 65 73 2f 52 65 63 6f 76 65 72 79 20 48 44 umes/Recovery.HD
0x000000010c0462ec 00 46 46 2d 2f 70 72 69 76 61 74 65 2f 76 61 72 .FF-/private/var
0x000000010c0462fc 2f 74 6d 70 2f 4d 50 50 5a 4c 50 52 50 00 69 6f /tmp/MPPZLPRP.io
0x000000010c04630c 6b 69 74 2e 2f 64 65 76 2f 64 69 73 6b 30 73 31 kit./dev/disk0s1
0x000000010c04631c 00 6c 79 00 2f 70 72 69 76 61 74 65 2f 74 6d 70 .ly./private/tmp
0x000000010c04632c 2f 44 64 6b 4a 57 79 6f 65 00 70 6c 2f 64 65 76 /DdkJWyoe.pl/dev
0x000000010c04633c 2f 64 69 73 6b 32 73 31 00 72 61 67 2f 56 6f 6c /disk2s1.rag/Vol
0x000000010c04634c 75 6d 65 73 2f 44 6f 63 73 00 6c 6f 2f 64 65 76 umes/Docs.lo/dev
0x000000010c04635c 2f 64 69 73 6b 32 73 31 00 00 00 00 2f 70 72 69 /disk2s1..../pri
0x000000010c04636c 76 61 74 65 2f 74 6d 70 2f 52 78 53 54 49 64 78 vate/tmp/RxSTIdx
0x000000010c04637c 41 00 63 73 2f 64 65 76 2f 64 69 73 6b 32 73 31 A.cs/dev/disk2s1
0x000000010c04638c 00 61 62 6c 2f 56 6f 6c 75 6d 65 73 2f 44 6f 63 .abl/Volumes/Doc
0x000000010c04639c 73 00 6c 6f 2f 64 65 76 2f 64 69 73 6b 32 73 31 s.lo/dev/disk2s1
0x000000010c0463ac 00 72 61 67 2f 55 73 65 72 73 2f 6a 70 2f 44 6f .rag/Users/jp/Do

While it identified references to the above files in a multitude of processes (a surprising amount, actually, that may need to be revisited in future research), we are trying to identify references to all of these files within a common process/context. So, the next step is to do a bit of analysis to see which process/context had at least 4 hits (because we had 4 file names to find). A bit of command line kung fu (gotta plug Hal Pomeranz‘s site, though *cough* he needs some new entries *cough*) yields the following:

$ grep 'Task:' ../Memory_Captures/mem.raw_yara_output | awk '{print $2}' | sort | uniq -c | sort -r
43 Finder
10 BlockBlock
6 mds
5 lsd
5 Google
2 loginwindow
2 coreservicesd
1 system_installd
1 sharingd
1 revisiond
1 pbs
1 mobileassetd
1 mdworker
1 crashpad_handler
1 configd
1 com.apple.geod
1 apsd
1 airportd
1 XprotectService
1 UserEventAgent
1 SubmitDiagInfo
1 Microsoft

We can weed out anything with less than 4 entries, leaving Google, lsd, mds, BlockBlock, and Finder. Google, lsd, and mds processes only had entries for FileZilla, so those are ruled out. BlockBlock is actually an awesome app by Patrick Wardle at Objective-See that watches for any applications that attempt persistence. So, it is of no surprise that all of these entries exist within its memory space as it has overseen each in their installation and alerted me if/when persistence (auto-start) mechanisms were implemented. Usefulness aside, it’s not our culprit here.

Now, we are left with Finder. So, let’s see what entries it found within the Finder process on my machine:

$ grep -A16 'Task: Finder' ../Memory_Captures/mem.raw_yara_output
Task: Finder pid 236 rule ds_store_searches addr 0x10ef4e2bc
0x000000010ef4e2bc 46 69 6c 65 5a 69 6c 6c 61 2d 49 6e 73 74 61 6c FileZilla-Instal
0x000000010ef4e2cc 6c 65 72 2e 61 70 70 00 39 31 30 2e 2f 56 6f 6c ler.app.910./Vol
0x000000010ef4e2dc 75 6d 65 73 2f 52 65 63 6f 76 65 72 79 20 48 44 umes/Recovery.HD
0x000000010ef4e2ec 00 46 46 2d 2f 70 72 69 76 61 74 65 2f 76 61 72 .FF-/private/var
0x000000010ef4e2fc 2f 74 6d 70 2f 4d 50 50 5a 4c 50 52 50 00 69 6f /tmp/MPPZLPRP.io
0x000000010ef4e30c 6b 69 74 2e 2f 64 65 76 2f 64 69 73 6b 30 73 31 kit./dev/disk0s1
0x000000010ef4e31c 00 6c 79 00 2f 70 72 69 76 61 74 65 2f 74 6d 70 .ly./private/tmp
0x000000010ef4e32c 2f 44 64 6b 4a 57 79 6f 65 00 70 6c 2f 64 65 76 /DdkJWyoe.pl/dev
0x000000010ef4e33c 2f 64 69 73 6b 32 73 31 00 72 61 67 2f 56 6f 6c /disk2s1.rag/Vol
0x000000010ef4e34c 75 6d 65 73 2f 44 6f 63 73 00 6c 6f 2f 64 65 76 umes/Docs.lo/dev
0x000000010ef4e35c 2f 64 69 73 6b 32 73 31 00 00 00 00 2f 70 72 69 /disk2s1..../pri
0x000000010ef4e36c 76 61 74 65 2f 74 6d 70 2f 52 78 53 54 49 64 78 vate/tmp/RxSTIdx
0x000000010ef4e37c 41 00 63 73 2f 64 65 76 2f 64 69 73 6b 32 73 31 A.cs/dev/disk2s1
0x000000010ef4e38c 00 61 62 6c 2f 56 6f 6c 75 6d 65 73 2f 44 6f 63 .abl/Volumes/Doc
0x000000010ef4e39c 73 00 6c 6f 2f 64 65 76 2f 64 69 73 6b 32 73 31 s.lo/dev/disk2s1
0x000000010ef4e3ac 00 72 61 67 2f 55 73 65 72 73 2f 6a 70 2f 44 6f .rag/Users/jp/Do
--
Task: Finder pid 236 rule ds_store_searches addr 0x6000001fd248
0x00006000001fd248 42 6c 6f 63 6b 42 6c 6f 63 6b 5f 49 6e 73 74 61 BlockBlock_Insta
0x00006000001fd258 6c 6c 65 72 2e 61 70 70 2f 1b 00 00 00 00 00 00 ller.app/.......
0x00006000001fd268 00 63 6f 6d 2e 6f 62 6a 65 63 74 69 76 65 53 65 .com.objectiveSe
0x00006000001fd278 65 2e 42 6c 6f 63 6b 42 6c 6f 63 6b 04 00 20 01 e.BlockBlock....
0x00006000001fd288 00 00 00 00 8e 00 10 00 02 00 00 00 c4 e5 c7 1d ................
0x00006000001fd298 00 00 00 00 00 00 00 00 00 00 00 00 00 00 00 00 ................
0x00006000001fd2a8 00 00 00 00 00 00 00 00 00 00 00 00 00 00 00 00 ................
0x00006000001fd2b8 00 00 00 00 00 00 00 00 00 00 00 00 00 00 00 00 ................
0x00006000001fd2c8 00 00 00 00 00 00 00 00 00 00 00 00 00 00 00 00 ................
0x00006000001fd2d8 00 00 00 00 00 00 00 00 00 00 00 00 00 00 00 00 ................
0x00006000001fd2e8 00 00 00 00 00 00 00 00 00 00 00 00 00 00 00 00 ................
0x00006000001fd2f8 00 00 00 00 00 00 00 00 00 00 00 00 00 00 00 00 ................
0x00006000001fd308 00 00 00 00 00 00 00 00 00 00 00 00 00 00 00 00 ................
0x00006000001fd318 00 00 00 00 00 00 00 00 47 09 00 00 00 00 00 00 ........G.......
0x00006000001fd328 00 00 00 00 00 00 00 00 47 0a 00 00 00 00 00 00 ........G.......
0x00006000001fd338 47 0b 00 00 00 00 00 00 47 0c 00 00 00 00 00 00 G.......G…….
--
Task: Finder pid 236 rule ds_store_searches addr 0x60000044e501
0x000060000044e501 63 61 6e 6f 6e 2d 6d 78 39 32 30 2d 31 39 5f 31 canon-mx920-19_1
0x000060000044e511 5f 30 61 2d 65 61 31 31 2e 64 6d 67 00 00 00 71 _0a-ea11.dmg...q
0x000060000044e521 91 d8 c5 ff ff 1d 00 8c 07 00 00 01 00 00 00 15 ................
0x000060000044e531 64 6e 67 2e 61 64 6f 62 65 2e 6e 69 6b 6f 6e 64 dng.adobe.nikond
0x000060000044e541 34 2e 63 61 6d 00 00 00 00 00 00 00 00 00 00 71 4.cam..........q
0x000060000044e551 91 d8 c5 ff ff 1d 00 8c 07 00 00 01 00 00 00 14 ................
0x000060000044e561 70 65 66 2e 70 65 6e 74 61 78 2e 37 37 39 37 30 pef.pentax.77970
0x000060000044e571 2e 63 61 6d 00 00 00 00 00 00 00 00 00 00 00 71 .cam...........q
0x000060000044e581 91 d8 c5 ff ff 1d 00 8c 07 00 00 01 00 00 00 10 ................
0x000060000044e591 61 72 77 2e 73 6f 6e 79 2e 32 39 36 2e 63 61 6d arw.sony.296.cam
0x000060000044e5a1 00 00 00 00 00 00 00 00 00 00 00 00 00 00 00 11 ................
0x000060000044e5b1 9c d8 c5 ff ff 1d 00 01 00 00 00 00 00 00 00 00 ................
0x000060000044e5c1 00 00 00 00 00 00 00 02 00 00 00 00 00 00 00 02 ................
0x000060000044e5d1 00 00 00 00 00 00 00 d0 65 01 00 00 60 00 00 71 ........e...`..q
0x000060000044e5e1 91 d8 c5 ff ff 1d 00 8c 07 00 00 01 00 00 00 11 ................
0x000060000044e5f1 6e 65 66 2e 6e 69 6b 6f 6e 2e 64 39 30 2e 63 61 nef.nikon.d90.ca
--
Task: Finder pid 236 rule ds_store_searches addr 0x600000a48d41
0x0000600000a48d41 53 70 6f 74 69 66 79 49 6e 73 74 61 6c 6c 65 72 SpotifyInstaller
0x0000600000a48d51 2e 7a 69 70 00 00 00 00 00 00 00 00 00 00 00 51 .zip...........Q
0x0000600000a48d61 93 d8 c5 ff ff 1d 00 c3 14 00 00 01 00 00 00 48 ...............H
0x0000600000a48d71 00 00 00 00 00 00 00 00 01 00 00 00 00 00 00 00 ................
0x0000600000a48d81 00 00 00 00 00 00 00 00 ab 1f 00 00 60 00 00 71 ............`..q
0x0000600000a48d91 91 d8 c5 ff ff 1d 00 8c 07 00 00 01 00 00 00 17 ................
0x0000600000a48da1 64 6e 67 2e 61 64 6f 62 65 2e 63 61 6e 6f 6e 65 dng.adobe.canone
0x0000600000a48db1 6f 73 6d 2e 63 61 6d 00 00 00 00 00 00 00 00 e0 osm.cam.........
0x0000600000a48dc1 41 db c5 ff 7f 00 00 01 00 00 00 00 00 00 00 c0 A...............
0x0000600000a48dd1 be 43 00 00 60 00 00 d8 be 43 00 00 60 00 00 d8 .C..`....C..`...
0x0000600000a48de1 be 43 00 00 60 00 00 00 00 00 00 00 00 00 00 71 .C..`..........q
0x0000600000a48df1 91 d8 c5 ff ff 1d 00 8c 07 00 00 0b 00 00 00 13 ................
0x0000600000a48e01 49 6e 73 74 61 6c 6c 20 53 70 6f 74 69 66 79 2e Install.Spotify.
0x0000600000a48e11 61 70 70 00 00 00 00 00 00 00 00 00 00 00 00 11 app.............
0x0000600000a48e21 9c d8 c5 ff ff 1d 00 01 00 00 00 00 00 00 00 00 ................
0x0000600000a48e31 00 00 00 00 00 00 00 02 00 00 00 00 00 00 00 02 ................
...

Sure enough, looks like we’ve likely found the harborer of our historical entries! And, it makes sense, as I surmise Finder is the process responsible for creating these .DS_Store files when they are moved to the trash. How might we be able to find out what process is responsible for creating this file? OSX has a nice little utility called fs_usage that can monitor all sorts of file system, disk, I/O aspects. For our purposes/testing here, we are going to filter on filesystem events and grep for the .Trash/.DS_Store file we care about while I go into Finder and delete (send to the Trash) a file:

$ sudo fs_usage -w -f filesystem | grep ".Trash/.DS_Store"
09:15:48.854558 fsgetpath /Users/jp/.Trash/.DS_Store 0.000010 Finder.2394967
09:15:49.357252 fsgetpath /Users/jp/.Trash/.DS_Store 0.000008 Finder.2395226
09:15:53.751509 getattrlist /Users/jp/.Trash/.DS_Store 0.000041 Finder.2395226
09:15:53.751556 fsgetpath /Users/jp/.Trash/.DS_Store 0.000008 Finder.2395226
09:15:53.751576 getattrlist /Users/jp/.Trash/.DS_Store 0.000019 Finder.2395226
09:15:53.751589 fsgetpath /Users/jp/.Trash/.DS_Store 0.000005 Finder.2395226
09:15:53.751717 fsgetpath /Users/jp/.Trash/.DS_Store 0.000007 Finder.2395226
09:15:53.751738 open F=21 (_W____) /Users/jp/.Trash/.DS_Store 0.000019 Finder.2395226
09:15:53.752898 HFS_update (__M_____) /Users/jp/.Trash/.DS_Store 0.000009 Finder.2395226
09:15:53.752905 HFS_update (__MN_c_m) /Users/jp/.Trash/.DS_Store 0.000003 Finder.2395226
09:15:53.752929 HFS_update (___N____) /Users/jp/.Trash/.DS_Store 0.000004 Finder.2395226
09:15:53.752956 HFS_update (___N_c_m) /Users/jp/.Trash/.DS_Store 0.000004 Finder.2395226
09:15:53.753005 HFS_update (_FMN_c_m) /Users/jp/.Trash/.DS_Store 0.000004 Finder.2395226
09:15:53.753157 getattrlist /Users/jp/.Trash/.DS_Store 0.000016 Finder.2395226
09:15:53.754084 WrData[AN] D=0x043832a0 B=0x5000 /dev/disk1 /Users/jp/.Trash/.DS_Store 0.001077 W Finder.2395226
09:15:53.804058 fsgetpath /Users/jp/.Trash/.DS_Store 0.000005 Finder.2395372
09:15:54.293014 lstat64 /Users/jp/.Trash/.DS_Store 0.000030 fseventsd.2395383

Sure enough, there it is. We can see Finder (re)creating the .Trash/.DS_Store file. Pretty cool, huh?

Now, why these entries are re-populated instead of just creating a blank/zero’ed file, we don’t yet quite know (this would take some more intensive inspection of the Finder code itself). Nonetheless, the Finder process definitely looks like a solid candidate responsible for (re)storing these these historical entries.

For even further testing and corroboration of our above findings (additional corroboration is ALWAYS a good idea in both investigations and research), we can use Volatility’s strings plugin. For most effective use, this plugin actually relies on a strings output file (fed as input to the plugin) with each string entry prepended with the decimal offset at which it was found (e.g., “102515331 file.dmg”). Keep in mind that in addition to the standard ASCII strings, we will also want to extract the Unicode 16-bit Big Endian strings as well.

Here we will use the GNU strings utility (gstrings on OSX via brew) to acquire this needed output. As a bit of a pro-tip, below is a great way to extract both ASCII and Unicode (16-bit Big Endian) in parallel using a FIFO queue:

$ mkfifo part-out
$ gstrings -a -td part-out > Memory_Captures/mem.raw.strings.ascii &

[1] 40780
$ cat Memory_Captures/mem.raw | tee part-out | gstrings -a -td -eb > Memory_Captures/mem.raw.strings.be

Once completed, let’s check out the format and see what it found for both the ASCII and Unicode Big-Endian strings:

$ sift "canon-mx920-19_1_0a-ea11.dmg" Memory_Captures/mem.raw.strings.ascii
25099281 canon-mx920-19_1_0a-ea11.dmg
26248704 ;/Volumes/Untitled/.Trashes/501/canon-mx920-19_1_0a-ea11.dmg
219280449 canon-mx920-19_1_0a-ea11.dmg
405926145 canon-mx920-19_1_0a-ea11.dmg
1114934737 canon-mx920-19_1_0a-ea11.dmg
1422508032 e: canon-mx920-19_1_0a-ea11.dmg
1913326497 canon-mx920-19_1_0a-ea11.dmg
4364841040 File: canon-mx920-19_1_0a-ea11.dmg
4454621776 File: canon-mx920-19_1_0a-ea11.dmg
4897694289 canon-mx920-19_1_0a-ea11.dmg
5379226560 ;/Volumes/Untitled/.Trashes/501/canon-mx920-19_1_0a-ea11.dmg
6315679704 File: canon-mx920-19_1_0a-ea11.dmg
7262910545 canon-mx920-19_1_0a-ea11.dmg
7624221584 File: canon-mx920-19_1_0a-ea11.dmg
7720217424 File: canon-mx920-19_1_0a-ea11.dmg
7720218576 File: canon-mx920-19_1_0a-ea11.dmg
8317281252 File: canon-mx920-19_1_0a-ea11.dmg
8317281288 File: canon-mx920-19_1_0a-ea11.dmg
8317283615 File: canon-mx920-19_1_0a-ea11.dmg
8317283651 File: canon-mx920-19_1_0a-ea11.dmg
8555763408 File: canon-mx920-19_1_0a-ea11.dmg
8800666640 File: canon-mx920-19_1_0a-ea11.dmg
8876241680 File: canon-mx920-19_1_0a-ea11.dmg
9351045649 canon-mx920-19_1_0a-ea11.dmg
9821317328 File: canon-mx920-19_1_0a-ea11.dmg
10051278021 $File: canon-mx920-19_1_0a-ea11.dmg
10051278106 $File: canon-mx920-19_1_0a-ea11.dmg
10058241281 canon-mx920-19_1_0a-ea11.dmg
10166913457 canon-mx920-19_1_0a-ea11.dmg
10166914465 canon-mx920-19_1_0a-ea11.dmg
10215457371 File: canon-mx920-19_1_0a-ea11.dmg
10215457407 File: canon-mx920-19_1_0a-ea11.dmg
10215459734 File: canon-mx920-19_1_0a-ea11.dmg
10215459770 File: canon-mx920-19_1_0a-ea11.dmg

And, now for Unicode Big-Endian:

$ sift "canon-mx920-19_1_0a-ea11.dmg" Memory_Captures/mem.raw.strings.be
5128627554 canon-mx920-19_1_0a-ea11.dmg
5128627664 canon-mx920-19_1_0a-ea11.dmg
5128627732 canon-mx920-19_1_0a-ea11.dmg
10079999330 canon-mx920-19_1_0a-ea11.dmg
10079999440 canon-mx920-19_1_0a-ea11.dmg
10079999508 canon-mx920-19_1_0a-ea11.dmg
10090625584 ile:///Users/jp/Downloads/canon-mx920-19_1_0a-ea11.dmg}

As we saw before when running our Yara scans against memory, we find many resident artifacts of our file name strings. A bit less in our Unicode output, but possibly useful findings nonetheless. No surprise here. But, let’s feed each of these into Volatility’s strings plugin to get some more context.

$ ./volatility_2.6_mac64_standalone --plugins=/Users/jp/Projects/volatility/volatility/plugins/ --profile=Mac10_12_2_x64x64 -f ~/Projects/Memory_Captures/mem.raw mac_strings -s ~/Projects/Memory_Captures/mem.raw.strings.ascii

And, now we wait… one day… two days… until Schrödinger’s cat got the best of me and I killed the process. After receiving a pro-tip from @attrc to filter down the strings file to just what we cared about (the 4 file names we put int our Yara rules file), I whittled it down to approximately 288 string entries (down from over 45 million – gah!) and re-ran it:

$ ./volatility_2.6_mac64_standalone --plugins=/Users/jp/Projects/volatility/volatility/plugins/ --profile=Mac10_12_2_x64x64 -f ~/Projects/Memory_Captures/mem.raw mac_strings -s ~/Projects/Memory_Captures/mem.raw.strings.ascii_FILTERED

…and waited another day before killing it and instead running it on a much faster desktop machine. Alas, it still took over a day to run on a 2.8GHz core i7 with 32GB memory, and yielded the following output:

25099281 [kernel:feacc17efc11] canon-mx920-19_1_0a-ea11.dmg
26248704 [kernel:feacc1908600] ;/Volumes/Untitled/.Trashes/501/canon-mx920-19_1_0a-ea11.dmg
33366720 [kernel:feacc1fd22c0] File: SpotifyInstaller.zip
33369120 [kernel:feacc1fd2c20] File: FileZilla-Installer.app
33369264 [kernel:feacc1fd2cb0] File: BlockBlock_Installer.app
81507152 [kernel:feacc4dbb350] File: FileZilla-Installer.app
96602320 [kernel:feacc5c208d0] +/Users/jp/Downloads/FileZilla-Installer.ap
...
10215459594 [kernel:feaf20e38b0a] File: BlockBlock_Installer.app
10215459626 [kernel:feaf20e38b2a] File: BlockBlock_Installer.app
10215459658 [kernel:feaf20e38b4a] File: BlockBlock_Installer.app
10215459734 [kernel:feaf20e38b96] File: canon-mx920-19_1_0a-ea11.dmg
10215459770 [kernel:feaf20e38bba] File: canon-mx920-19_1_0a-ea11.dmg
10230120017 [kernel:feaf21c33e51] BlockBlock_Installer.app

“kernel”? That’s it? No process association?

Well, that’s unfortunately less than useful for us. According to the wiki entry for the strings plugin, “For a given image and a file with lines of the form :, or , output the corresponding process and virtual addresses where that string can be found.” In reading that, I expected output similar to (or better than) the yarascan plugin in being able to pair the string hit(s) to the associated process. Alas, ’tis not the case.

Nonetheless, we seem to have some very useful findings to satisfy hypothesis #2.

Conclusion

In conclusion, while hypothesis #2 looks rather satisfied by our testing, we are still left with the following questions:

1) Why are these entries re-populated when a .DS_Store file is re-created?
2) What causes this behavior?
3) How is this information pulled into the re-created .DS_Store file?
4) Why are only certain files resident and not every file ever deleted from the machine?*
*My testing shows that the entries are purged upon reboot, so this last question is mostly answered. Though, we still don’t know why it happens.

If anyone has any insight into this, I would be INCREDIBLY interested to hear about it.

/JP

Page 1 of 2

Powered by WordPress & Theme by Anders Norén