Musings and confusings. All things DFIR.

Month: February 2017

OSX (Mac) Memory Acquisition and Analysis Using OSXpmem and Volatility

Macs don’t get much love in the forensics community, aside from @iamevltwin (Sarah Edwards), @patrickolsen (Patrick Olsen), @patrickwardle (Patrick Wardle), and a few other incredibly awesome pioneers in the field. We see blog posts all the time about Windows forensics and malware analysis techniques, along with some Linux forensic analysis, but rarely do we see any posts about Mac technical/forensic analysis or techniques. I find this odd, considering the surge in usage and deployment over the last several years, particularly within enterprises. Well, with my most recent two part Mac post as well as this one, I’m attempting to change this, my friends!

Macs need love and disk/memory analysis as well, amirite?

Let’s have a look at memory acquisition of OSX systems using a nifty tool called OSXpmem.

OSXpmem is a part of the pmem suite created by the developers of Rekall. Rekall itself is actually a very useful utility built for both memory acquisition and live memory analysis on Windows, Linux, and OSX systems. While I will be delving into Rekall in a future post, for this we will simply be focusing on OSXpmem, which is an awesome command-line utility for quickly and easily collecting RAM from a Mac system. One of its greatest features is its output to an AFF4 volume, which has a ton of useful features (likely to be discussed in a dedicated post in the future as well).

Acquiring Memory

So, what’s the easiest way to get up and running with the tool for memory acquisition?

  1. Download latest release (as of this post, the latest osxpmem release is “2.1.post4”).
  2. Unzip the package
    1. $ unzip osxpmem.osxpmem-2.1.post4.zip
  3. Run it to collect memory from the local system
    1. $ ./osxpmem.app/osxpmem -o <output_dir>

Super simple, right?

Wellll, maybe not that simple. When you run it, even as sudo/root, you may get the following error:

$ sudo osxpmem.app/osxpmem -o Memory_Captures/mem.aff4
Imaging memory
E1229 15:17:26.335978 3375588288 aff4_file.cc:289] Can not open file /dev/pmem :No such file or directory
/Users/jp/Projects/osxpmem.app/MacPmem.kext failed to load - (libkern/kext) authentication failure (file ownership/permissions); check the system/kernel logs for errors or try kextutil(8).
E1229 15:17:26.606639 3375588288 osxpmem.cc:283] Unable to load driver at /Users/jp/Projects/osxpmem.app/MacPmem.kext
E1229 15:17:26.606714 3375588288 pmem_imager.cc:328] Imaging failed with error: -8

How usefully nondescript. Let me save you some time, as searching the system/kernel logs as suggested yields nothing useful.

So, instead, let’s use the native utility kextutil’s “test” parameter (-t) to see if that gets us anywhere…

$ sudo kextutil -t osxpmem.app/MacPmem.kext/
Diagnostics for osxpmem.app/MacPmem.kext:
Authentication Failures:
File owner/permissions are incorrect (must be root:wheel, nonwritable by group/other):
osxpmem.app/MacPmem.kext
Contents
_CodeSignature
CodeResources
Info.plist
MacOS
MacPmem

Nice. It finally tells us what’s wrong. The file ownership/permissions must be changed to “root:wheel”. Easy enough…

$ sudo chown -R root:wheel osxpmem.app/

So, let’s try again…

$ sudo osxpmem.app/osxpmem -o Memory_Captures/mem.aff4
Imaging memory
Creating output AFF4 ZipFile.
Reading 0x8000 0MiB / 8095MiB 0MiB/s
Reading 0xe38000 14MiB / 8095MiB 56MiB/s
Reading 0x1c88000 28MiB / 8095MiB 56MiB/s
Reading 0x2ac0000 42MiB / 8095MiB 56MiB/s
Reading 0x3978000 57MiB / 8095MiB 58MiB/s
Reading 0x47c8000 71MiB / 8095MiB 56MiB/s
Reading 0x5678000 86MiB / 8095MiB 58MiB/s
Reading 0x6500000 101MiB / 8095MiB 57MiB/s

Reading 0x1f7478000 8052MiB / 8095MiB 39MiB/s
Reading 0x1f7d68000 8061MiB / 8095MiB 35MiB/s
Reading 0x1f8708000 8071MiB / 8095MiB 38MiB/s
Reading 0x1f9150000 8081MiB / 8095MiB 41MiB/s
Reading 0x1f9c00000 8092MiB / 8095MiB 41MiB/s

YES! It worked! As you can see, my system has 8GB of memory that was (by default) exported to an AFF4 volume/file called “mem.aff4”.

You also have the option to include additional local files within the resulting AFF4 volume/file via the “-i </path/to/file> -i </path/to/file> …” command line option(s), which can be useful in producing a singular output volume containing not only memory but other files (binaries/logs/etc.) you’d like to analyze as well. In the past, I used this option to collect the local /bin/bash file when Volatility used to require the bash shell’s memory address be provided in order to parse command history and produce associated timestamps when using the linux_bash plugin. Though the documentation still shows it as a requirement, it’s actually not needed anymore and parses it all just fine.

In addition, you may also export the memory image to a singular RAW or ELF file by using the “–format elf” or “–format raw” command line options if that suits your fancy. However, for this post, I am using the default AFF4 output so that we may explore its use and features a bit.

So, without further ado, let’s take a look at the resulting AFF4 volume/file.

$ sudo osxpmem.app/osxpmem -V Memory_Captures/mem.aff4
Password:
@prefix rdf: <http://www.w3.org/1999/02/22-rdf-syntax-ns#> .
@prefix aff4: <http://aff4.org/Schema#> .
@prefix xsd: <http://www.w3.org/2001/XMLSchema#> .
@prefix memory: <http://aff4.org/Schema#memory/> .
<aff4://7f482355-5683-46bb-87c0-21afd75dbbeb/dev/pmem>
aff4:category memory:physical ;
aff4:stored <aff4://7f482355-5683-46bb-87c0-21afd75dbbeb> ;
a aff4:map .
<aff4://7f482355-5683-46bb-87c0-21afd75dbbeb/dev/pmem/data>
aff4:chunk_size 32768 ;
aff4:chunks_per_segment 1024 ;
aff4:compression <https://www.ietf.org/rfc/rfc1950.txt> ;
aff4:size 8488656896 ;
aff4:stored <aff4://7f482355-5683-46bb-87c0-21afd75dbbeb> ;
a aff4:image .
Objects in use:
Objects in cache:
aff4://7f482355-5683-46bb-87c0-21afd75dbbeb - 0
aff4://7f482355-5683-46bb-87c0-21afd75dbbeb/information.turtle - 0
file:///Users/jp/Projects/Memory_Captures/mem.aff4 - 0

Here, you can see that we extracted a memory image to the AFF4 stream “7f482355-5683-46bb-87c0-21afd75dbbeb/dev/pmem“.

Now, what can we do with this? Well, one thing you could do (if not using Rekall to analyze this image) might be to extract the AFF4 memory image stream into a singular raw file for parsing/analysis by other tools such as Volatility, page_brute, yara, strings, etc. To do that, we perform the following:

$ sudo osxpmem.app/osxpmem -e /dev/pmem -o Memory_Captures/mem.raw Memory_Captures/mem.aff4
Extracting aff4://7f482355-5683-46bb-87c0-21afd75dbbeb/dev/pmem into file:///Users/jp/Projects/Memory_Captures/mem.raw
Reading 0x8000 0MiB / 9968MiB 0MiB/s
Reading 0x750000 7MiB / 9968MiB 28MiB/s
Reading 0xde0000 13MiB / 9968MiB 25MiB/s
Reading 0x1480000 20MiB / 9968MiB 25MiB/s

Reading 0x26d938000 9945MiB / 9968MiB 21MiB/s
Reading 0x26deb8000 9950MiB / 9968MiB 21MiB/s
Reading 0x26e418000 9956MiB / 9968MiB 20MiB/s
Reading 0x26eab0000 9962MiB / 9968MiB 25MiB/s

$ ls -l Memory_Captures/
total 25665056
-rwxr-xr-x 1 root staff 2688302741 Dec 29 15:30 mem.aff4
-rwxr-xr-x 1 root staff 10452205568 Dec 29 16:10 mem.raw

As you can see, the raw image is uncompressed and thus substantially larger than the AFF4 volume (one of the useful features of AFF4 is its compression options). Nonetheless, there you have it. A raw memory image to parse to your heart’s content with whatever tools you like.

However, before we move on, I personally like to unload the kernel extension for one last good measure so that it’s not just hanging out there for no purpose.

$ sudo osxpmem.app/osxpmem -u
Unloading driver /Users/jp/Projects/osxpmem.app/MacPmem.kext

Creating a Memory Profile

**Update 11/2019**

The dwarfdump conversion process using Volatility’s convert.py utility is broken for any recent version of OSX/MacOS. If you try to perform it, you will likely get a “State machine broken! level 0!” error stemming from this area in the convert.py code. I am unaware of any current fix for this as it appears the Volatility team is focusing all their efforts in the Volatility 3 build.

——

Acquiring a memory image is great, but unfortunately is useless (with respect to Volatility) without the appropriate profile to parse it. Volatility requires a memory profile be specified when parsing a memory image via the “–profile=<profile>” command line option. By default, Volatility includes a ton of profiles for Windows, but such is not the case for Linux and Mac. Though a profiles repository has been created containing a substantial set of profiles for Linux and Mac, YMMV. In my situation, I’m running the latest MacOS Sierra release 10.12.3, for which no profile existed as of this post (nor did it for 10.12.2 until I created and submitted one to the repo as well :D). Therefore, I had to create my own profile. Luckily, the folks at Volatility do a great job walking us through building a profile on a Mac. Though, there are a few clarifications I’d like to address.

To begin, I need to provide some clarification/correction for the initial step, focusing on the part in italics:

“To create a profile, you first need to download the KernelDebugKit for the kernel you want to analyze. This can be downloaded from the Apple Developer’s website (click OS X Kernel Debug Kits on the right). This account is free and only requires a valid Email address.

After the DebugKit is downloaded, mount the dmg file. This will place the contents at “/Volumes/KernelDebugKit”.”

While the above statement is true, if you immediately dismount a package once it’s installed like I do, you should instead pay attention to the installer to see where it is putting the files for long term access. Independent of the mounted package, the KDK is installed in the following location, which will need to be referenced for future use once the package is dismounted post-install:

/Library/Developer/KDKs/KDK_<version>.kdk/

As of current, for macOS Sierra 10.12.2 and 10.12.3, the <version> will be “10.12.2_16C67” and “KDK_10.12.3_16D32.kdk“, respectively.

/Library/Developer/KDKs/KDK_10.12.2_16C67.kdk/
/Library/Developer/KDKs/KDK_10.12.3_16D32.kdk/

Thus, “Step 1” for building a 10.12.3 profile would be the following (for a 64-bit 10.12.3 system):

$ dwarfdump -arch x86_64 /Library/Developer/KDKs/KDK_10.12.3_16D32.kdk/System/Library/Kernels/kernel.dSYM > 10.12.3_x64.dwarfdump

Also note that the referenced kernel file names vary from the current instructions (e.g., “mach_kernel.dSYM” is now “kernel.dSYM”, and “mach_kernel” is now just “kernel”). So, do exercise additional caution when running the commands. For ease of reference, below should be the locations for both of these files on a macOS Sierra 10.12.3 64-bit system (but note that this may change with future versions):

/Library/Developer/KDKs/KDK_10.12.3_16D32.kdk/System/Library/Kernels/kernel
/Library/Developer/KDKs/KDK_10.12.3_16D32.kdk/System/Library/Kernels/kernel.dSYM

All of the above is actually noted during the install as well:

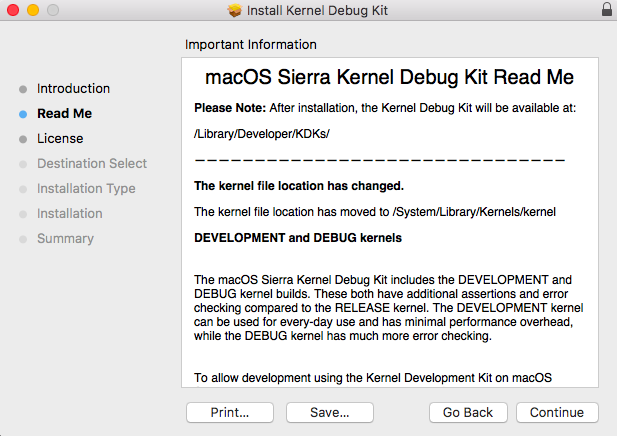
To save everyone a bit of time and translation from current Volatility documentation, I’ve written out the latest required steps below for relatively easy copy/paste into your terminal. For this, we are using the latest 10.12.3 release and associated KDK as an example:

  1. Check to see if a profile is already available for your particular OSX version/release
    1. https://github.com/volatilityfoundation/profiles/tree/master/Mac
  2. If not, download and install the KDK appropriate for your current (or targeted) OSX version/release
    1. http://developer.apple.com/hardwaredrivers
  3. Get the dwarf debug info from the kernel.
    1. $ dwarfdump -arch x86_64 /Library/Developer/KDKs/KDK_10.12.3_16D32.kdk/System/Library/Kernels/kernel.dSYM > 10.12.3_x64.dwarfdump
  4. Convert the dwarfdump output to Linux style output readable by Volatility
    1. $ python tools/mac/convert.py 10.12.3_x64.dwarfdump converted-10.12.3_x64.dwarfdump
  5. Create the types from the converted file
    1. $ python tools/mac/convert.py converted-10.12.3_x64.dwarfdump > 10.12.3.64bit.vtypes
  6. Generate symbol information
    1. $ dsymutil -s -arch x86_64 /Library/Developer/KDKs/KDK_10.12.3_16D32.kdk/System/Library/Kernels/kernel > 10.12.3.64bit.symbol.dsymutil
  7. Create a zip file of the *.dsymutil and *.vtypes files
    1. $ zip 10.12.3.64bit.zip 10.12.3.64bit.symbol.dsymutil 10.12.3.64bit.vtypes
    2. **See note at end of instructions**
  8. Copy the zip file to to the volatility/plugins/overlays/mac/ directory (remember, we are already inside the root /volatility directory)
    1. $ cp 10.12.3.64bit.zip volatility/plugins/overlays/mac/
  9. Verify your profile is registered and ready for use
    1. $ python vol.py --info | grep "A Profile for Mac"
      1. The profile name presented is the string you will pass to the “–profile=” parameter when analyzing a memory image from this version/release in Volatility

**Note: While I append “x64” or “64bit” to my various output files to keep track of which architecture build I’m producing, doing so for the final .zip output file yields profile names with rather weird-looking duplicate 64-bit identifiers (e.g., “Mac10_12_3_64bitx64”). If you would like cleaner looking profile names (at the cost of losing the filename identifier denoting the arch build), you should instead drop the trailing identifier and provide a name the file like the following “10.12.3.zip”, thus yielding a prettier (IMO) profile name like “Mac10_12_3x64”.

Using Volatility for Analysis

Once we have successfully created the appropriate profile for the acquired image, we can now use the plethora of native Volatility Mac OSX plugins provided to us for analysis.

To see the list of available plugins, simply type the following:

#Executed from within the root /volatility folder of a git cloned repo
$ python vol.py --info | grep "mac_"

#Using the standalone binary
$ ./volatility_2.6_mac64_standalone --info | grep "mac_"

Conclusion

That pretty much wraps it up for this post. There is certainly more to explore with OSXpmem, the AFF4 format, and Volatility. However, I encourage you to explore it on your own as I would like to save some feature exploration for future in-depth posts focused on using both Volatility and the Rekall suite.

/JP

Mac Dumpster Diving – Identifying Deleted File References in the Trash (.DS_Store) Files – Part 2

In Part 1 of this post, we identified where these artifacts reside along with options for parsing them. However, we still have not addressed why/how this anomaly occurs. Thus, in Part 2 of this post, we must now test to see how/why this occurs.

The behavior we’re seeing led me to the following hypothesis for testing:

  1. Although the .DS_Store file is “deleted”, when it is re-created it is created in the same space on disk within the same previously allocated blocks on the volume.
    1. *Note: This same situation often occurs on Windows when event logs are cleared/deleted and the event log file is re-created. The re-created log file often inhabits an area on disk surrounding previously deleted entries that may or may not be relevant to the current log at hand. Thus, carving of that file for entries can yield various event entries.
  2. The .DS_Store entries are stored somewhere else on disk and/or memory and are referenced and re-populated within the file upon re-creation for some reason (what reason, I have no idea).
  3. …or another theory that might make sense. (Please share your hypothesis or factual knowledge!)

I tested #1 above by using the “stat” command to see if a deleted and then re-created .DS_Store file would occupy the same inode and it does not. However, I still leave room for the possibility that even though a new inode is associated with the file each time it is re-created, it may still be somehow occupying (some of) the same space on disk.

I tested the on-disk aspect of #2 by searching across all files on disk for any references to a file that was previously deleted (since reboot) – the installer for BlockBlock named “BlockBlock_Installer.app”. The following files stood out to me:

$ sudo sift -z -a -l --err-skip-line-length BlockBlock_Installer.app /
...
/private/var/audit/20161217022600.crash_recovery
/private/var/db/uuidtext/AC/AF78F7097534A2A72631F3DD0AFE52
/private/var/folders/q4/r796r6tx2sd7zhjsxn2bjmv00000gn/0/com.apple.LaunchServices-175-v2.csstore
/private/var/folders/zz/zyxvpxvq6csfxvn_n0000000000000/0/com.apple.LaunchServices-175-v2.csstore
/.Spotlight-V100/Store-V2/3AF86A9A-8A7B-414A-8479-E5FACBC49DF1/Cache/0000/0000/000f/997405.txt
...

While each of the above files did contain references to the given file name, none of them contained anything relevant to our research here to indicate they were the culprit of our .DS_Store file entry repopulation issue.

As an aside, the last entry was actually the Spotlight indexed (cached) Evernote page I have been using to take notes for this research 🙂 Do note that the Spotlight database and cache directories are also great places to search for references to deleted files as well, to possibly include full content that has been cached by indexing.

Moving on, I then tested the in-memory aspect of #2 by capturing a memory image (will author a separate blog post on doing this later) from my system and using Volatility’s yarascan and strings plugins to identify where in memory these entries may reside. I debated just showing the end results here, but I figure there is merit in showing how I got to the results as well. So, bonus for everyone!

Volatility’s yarascan plugin (specifically, mac_yarascan for our use on a Mac image) takes a yara rules file, finds matches across a memory image with the associated files/processes/memory areas, and (optionally) dumps the resulting files for analysis. So, this would seem rather useful for our situation here in trying to identify where in memory the historical deleted file references currently exist. To begin, I created the following yara rules file containing references to files that have been deleted from my system but whose entries still remain in the .Trash./DS_Store file.

rule ds_store_searches
{
strings:
$s1=”BlockBlock_Installer.app”
$s2=”canon-mx920-19_1_0a-ea11.dmg”
$s3=”FileZilla-Installer.app”
$s4=”SpotifyInstaller.zip”

condition:
any of them
}

As you can see, I’ve installed a few programs recently, the packages of which I deleted upon successful installation. However, these entries continue to be re-populated back into the .Trash/.DS_Store file on my system as I have not rebooted since I deleted them.

Using the latest release (2.6) of Volatility’s standalone OSX executable along with a custom macOS Sierra 10.12.2 profile I manually generated (and is now available in the Mac profiles repository for all to use!), I scanned the memory image for references to the above files using the mac_yarascan plugin as shown below.

$ ./volatility_2.6_mac64_standalone --plugins=/Users/jp/Projects/volatility/volatility/plugins/ --profile=Mac10_12_2_x64x64 -f ~/Projects/Memory_Captures/mem.raw mac_yarascan -A -y ~/Projects/Yara/ds_store.yar

I’m not going to lie to you, this ran for the better part of a day on my 2015 Core i5 MBA against an 8GB memory image. So, don’t expect speedy results from running this plugin.

=== Begin Sidebar ===

In comparison to the above, running Yara against the image took just under 3 minutes. However, the two tools are doing different things (to an extent) and producing different results.

Yara simply scanned the image and output the location(s) within memory where each hit was identified:

$ yara -s -p 8 ~/Projects/Yara/ds_store.yar mem.raw
0x1fd2cb6:$s1: BlockBlock_Installer.app
0xd380f26:$s1: BlockBlock_Installer.app
0x27b8d40c:$s1: BlockBlock_Installer.app
0x45dbd248:$s1: BlockBlock_Installer.app
0x46fa6195:$s1: BlockBlock_Installer.app

0x17efc11:$s2: canon-mx920-19_1_0a-ea11.dmg
0x1908620:$s2: canon-mx920-19_1_0a-ea11.dmg
0xd11f441:$s2: canon-mx920-19_1_0a-ea11.dmg
0x1831f101:$s2: canon-mx920-19_1_0a-ea11.dmg
0x42748dd1:$s2: canon-mx920-19_1_0a-ea11.dmg

0x1fd2c26:$s3: FileZilla-Installer.app
0x4dbb356:$s3: FileZilla-Installer.app
0x5c208e5:$s3: FileZilla-Installer.app
0x141bbf81:$s3: FileZilla-Installer.app
0x22be06cc:$s3: FileZilla-Installer.app
...
0x1fd22c6:$s4: SpotifyInstaller.zip
0xc5030c6:$s4: SpotifyInstaller.zip
0x41c95ee6:$s4: SpotifyInstaller.zip
0x54c9c5d9:$s4: SpotifyInstaller.zip
0x54c9c5f6:$s4: SpotifyInstaller.zip

These hits can be verified and further investigated by hexdump:

$ hexdump -C -s 0x1fd2cb6 -n 100 mem.raw
01fd2cb6 42 6c 6f 63 6b 42 6c 6f 63 6b 5f 49 6e 73 74 61 |BlockBlock_Insta|
01fd2cc6 6c 6c 65 72 2e 61 70 70 20 0a ad be b5 29 2e a8 |ller.app ....)..|
01fd2cd6 dd ba 80 f9 45 00 00 60 00 00 00 00 00 00 00 00 |....E..`........|
01fd2ce6 00 00 00 00 00 00 00 00 00 00 a4 fa ef 3d 33 33 |.............=33|
01fd2cf6 eb 3f 00 00 00 00 00 00 00 00 08 00 00 00 00 00 |.?..............|
01fd2d06 00 00 40 04 00 00 00 00 00 00 1b 04 00 00 00 00 |..@.............|
01fd2d16 00 00 00 98 |....|

While this is great and shows us that these historical references exist across a ton of areas within memory, it doesn’t really help us identify any useful context. Nonetheless, Yara is an incredibly useful tool that has a variety of purposes, so it’s just a matter of knowing your tools and which one you need to do a given job.

=== End Sidebar ===

Volatility’s mac_yarascan output provided a lot of useful results with context. Just what we needed! Below is a sample entry:

Task: lsd pid 230 rule ds_store_searches addr 0x10c0462bc
0x000000010c0462bc 46 69 6c 65 5a 69 6c 6c 61 2d 49 6e 73 74 61 6c FileZilla-Instal
0x000000010c0462cc 6c 65 72 2e 61 70 70 00 39 31 30 2e 2f 56 6f 6c ler.app.910./Vol
0x000000010c0462dc 75 6d 65 73 2f 52 65 63 6f 76 65 72 79 20 48 44 umes/Recovery.HD
0x000000010c0462ec 00 46 46 2d 2f 70 72 69 76 61 74 65 2f 76 61 72 .FF-/private/var
0x000000010c0462fc 2f 74 6d 70 2f 4d 50 50 5a 4c 50 52 50 00 69 6f /tmp/MPPZLPRP.io
0x000000010c04630c 6b 69 74 2e 2f 64 65 76 2f 64 69 73 6b 30 73 31 kit./dev/disk0s1
0x000000010c04631c 00 6c 79 00 2f 70 72 69 76 61 74 65 2f 74 6d 70 .ly./private/tmp
0x000000010c04632c 2f 44 64 6b 4a 57 79 6f 65 00 70 6c 2f 64 65 76 /DdkJWyoe.pl/dev
0x000000010c04633c 2f 64 69 73 6b 32 73 31 00 72 61 67 2f 56 6f 6c /disk2s1.rag/Vol
0x000000010c04634c 75 6d 65 73 2f 44 6f 63 73 00 6c 6f 2f 64 65 76 umes/Docs.lo/dev
0x000000010c04635c 2f 64 69 73 6b 32 73 31 00 00 00 00 2f 70 72 69 /disk2s1..../pri
0x000000010c04636c 76 61 74 65 2f 74 6d 70 2f 52 78 53 54 49 64 78 vate/tmp/RxSTIdx
0x000000010c04637c 41 00 63 73 2f 64 65 76 2f 64 69 73 6b 32 73 31 A.cs/dev/disk2s1
0x000000010c04638c 00 61 62 6c 2f 56 6f 6c 75 6d 65 73 2f 44 6f 63 .abl/Volumes/Doc
0x000000010c04639c 73 00 6c 6f 2f 64 65 76 2f 64 69 73 6b 32 73 31 s.lo/dev/disk2s1
0x000000010c0463ac 00 72 61 67 2f 55 73 65 72 73 2f 6a 70 2f 44 6f .rag/Users/jp/Do

While it identified references to the above files in a multitude of processes (a surprising amount, actually, that may need to be revisited in future research), we are trying to identify references to all of these files within a common process/context. So, the next step is to do a bit of analysis to see which process/context had at least 4 hits (because we had 4 file names to find). A bit of command line kung fu (gotta plug Hal Pomeranz‘s site, though *cough* he needs some new entries *cough*) yields the following:

$ grep 'Task:' ../Memory_Captures/mem.raw_yara_output | awk '{print $2}' | sort | uniq -c | sort -r
43 Finder
10 BlockBlock
6 mds
5 lsd
5 Google
2 loginwindow
2 coreservicesd
1 system_installd
1 sharingd
1 revisiond
1 pbs
1 mobileassetd
1 mdworker
1 crashpad_handler
1 configd
1 com.apple.geod
1 apsd
1 airportd
1 XprotectService
1 UserEventAgent
1 SubmitDiagInfo
1 Microsoft

We can weed out anything with less than 4 entries, leaving Google, lsd, mds, BlockBlock, and Finder. Google, lsd, and mds processes only had entries for FileZilla, so those are ruled out. BlockBlock is actually an awesome app by Patrick Wardle at Objective-See that watches for any applications that attempt persistence. So, it is of no surprise that all of these entries exist within its memory space as it has overseen each in their installation and alerted me if/when persistence (auto-start) mechanisms were implemented. Usefulness aside, it’s not our culprit here.

Now, we are left with Finder. So, let’s see what entries it found within the Finder process on my machine:

$ grep -A16 'Task: Finder' ../Memory_Captures/mem.raw_yara_output
Task: Finder pid 236 rule ds_store_searches addr 0x10ef4e2bc
0x000000010ef4e2bc 46 69 6c 65 5a 69 6c 6c 61 2d 49 6e 73 74 61 6c FileZilla-Instal
0x000000010ef4e2cc 6c 65 72 2e 61 70 70 00 39 31 30 2e 2f 56 6f 6c ler.app.910./Vol
0x000000010ef4e2dc 75 6d 65 73 2f 52 65 63 6f 76 65 72 79 20 48 44 umes/Recovery.HD
0x000000010ef4e2ec 00 46 46 2d 2f 70 72 69 76 61 74 65 2f 76 61 72 .FF-/private/var
0x000000010ef4e2fc 2f 74 6d 70 2f 4d 50 50 5a 4c 50 52 50 00 69 6f /tmp/MPPZLPRP.io
0x000000010ef4e30c 6b 69 74 2e 2f 64 65 76 2f 64 69 73 6b 30 73 31 kit./dev/disk0s1
0x000000010ef4e31c 00 6c 79 00 2f 70 72 69 76 61 74 65 2f 74 6d 70 .ly./private/tmp
0x000000010ef4e32c 2f 44 64 6b 4a 57 79 6f 65 00 70 6c 2f 64 65 76 /DdkJWyoe.pl/dev
0x000000010ef4e33c 2f 64 69 73 6b 32 73 31 00 72 61 67 2f 56 6f 6c /disk2s1.rag/Vol
0x000000010ef4e34c 75 6d 65 73 2f 44 6f 63 73 00 6c 6f 2f 64 65 76 umes/Docs.lo/dev
0x000000010ef4e35c 2f 64 69 73 6b 32 73 31 00 00 00 00 2f 70 72 69 /disk2s1..../pri
0x000000010ef4e36c 76 61 74 65 2f 74 6d 70 2f 52 78 53 54 49 64 78 vate/tmp/RxSTIdx
0x000000010ef4e37c 41 00 63 73 2f 64 65 76 2f 64 69 73 6b 32 73 31 A.cs/dev/disk2s1
0x000000010ef4e38c 00 61 62 6c 2f 56 6f 6c 75 6d 65 73 2f 44 6f 63 .abl/Volumes/Doc
0x000000010ef4e39c 73 00 6c 6f 2f 64 65 76 2f 64 69 73 6b 32 73 31 s.lo/dev/disk2s1
0x000000010ef4e3ac 00 72 61 67 2f 55 73 65 72 73 2f 6a 70 2f 44 6f .rag/Users/jp/Do
--
Task: Finder pid 236 rule ds_store_searches addr 0x6000001fd248
0x00006000001fd248 42 6c 6f 63 6b 42 6c 6f 63 6b 5f 49 6e 73 74 61 BlockBlock_Insta
0x00006000001fd258 6c 6c 65 72 2e 61 70 70 2f 1b 00 00 00 00 00 00 ller.app/.......
0x00006000001fd268 00 63 6f 6d 2e 6f 62 6a 65 63 74 69 76 65 53 65 .com.objectiveSe
0x00006000001fd278 65 2e 42 6c 6f 63 6b 42 6c 6f 63 6b 04 00 20 01 e.BlockBlock....
0x00006000001fd288 00 00 00 00 8e 00 10 00 02 00 00 00 c4 e5 c7 1d ................
0x00006000001fd298 00 00 00 00 00 00 00 00 00 00 00 00 00 00 00 00 ................
0x00006000001fd2a8 00 00 00 00 00 00 00 00 00 00 00 00 00 00 00 00 ................
0x00006000001fd2b8 00 00 00 00 00 00 00 00 00 00 00 00 00 00 00 00 ................
0x00006000001fd2c8 00 00 00 00 00 00 00 00 00 00 00 00 00 00 00 00 ................
0x00006000001fd2d8 00 00 00 00 00 00 00 00 00 00 00 00 00 00 00 00 ................
0x00006000001fd2e8 00 00 00 00 00 00 00 00 00 00 00 00 00 00 00 00 ................
0x00006000001fd2f8 00 00 00 00 00 00 00 00 00 00 00 00 00 00 00 00 ................
0x00006000001fd308 00 00 00 00 00 00 00 00 00 00 00 00 00 00 00 00 ................
0x00006000001fd318 00 00 00 00 00 00 00 00 47 09 00 00 00 00 00 00 ........G.......
0x00006000001fd328 00 00 00 00 00 00 00 00 47 0a 00 00 00 00 00 00 ........G.......
0x00006000001fd338 47 0b 00 00 00 00 00 00 47 0c 00 00 00 00 00 00 G.......G…….
--
Task: Finder pid 236 rule ds_store_searches addr 0x60000044e501
0x000060000044e501 63 61 6e 6f 6e 2d 6d 78 39 32 30 2d 31 39 5f 31 canon-mx920-19_1
0x000060000044e511 5f 30 61 2d 65 61 31 31 2e 64 6d 67 00 00 00 71 _0a-ea11.dmg...q
0x000060000044e521 91 d8 c5 ff ff 1d 00 8c 07 00 00 01 00 00 00 15 ................
0x000060000044e531 64 6e 67 2e 61 64 6f 62 65 2e 6e 69 6b 6f 6e 64 dng.adobe.nikond
0x000060000044e541 34 2e 63 61 6d 00 00 00 00 00 00 00 00 00 00 71 4.cam..........q
0x000060000044e551 91 d8 c5 ff ff 1d 00 8c 07 00 00 01 00 00 00 14 ................
0x000060000044e561 70 65 66 2e 70 65 6e 74 61 78 2e 37 37 39 37 30 pef.pentax.77970
0x000060000044e571 2e 63 61 6d 00 00 00 00 00 00 00 00 00 00 00 71 .cam...........q
0x000060000044e581 91 d8 c5 ff ff 1d 00 8c 07 00 00 01 00 00 00 10 ................
0x000060000044e591 61 72 77 2e 73 6f 6e 79 2e 32 39 36 2e 63 61 6d arw.sony.296.cam
0x000060000044e5a1 00 00 00 00 00 00 00 00 00 00 00 00 00 00 00 11 ................
0x000060000044e5b1 9c d8 c5 ff ff 1d 00 01 00 00 00 00 00 00 00 00 ................
0x000060000044e5c1 00 00 00 00 00 00 00 02 00 00 00 00 00 00 00 02 ................
0x000060000044e5d1 00 00 00 00 00 00 00 d0 65 01 00 00 60 00 00 71 ........e...`..q
0x000060000044e5e1 91 d8 c5 ff ff 1d 00 8c 07 00 00 01 00 00 00 11 ................
0x000060000044e5f1 6e 65 66 2e 6e 69 6b 6f 6e 2e 64 39 30 2e 63 61 nef.nikon.d90.ca
--
Task: Finder pid 236 rule ds_store_searches addr 0x600000a48d41
0x0000600000a48d41 53 70 6f 74 69 66 79 49 6e 73 74 61 6c 6c 65 72 SpotifyInstaller
0x0000600000a48d51 2e 7a 69 70 00 00 00 00 00 00 00 00 00 00 00 51 .zip...........Q
0x0000600000a48d61 93 d8 c5 ff ff 1d 00 c3 14 00 00 01 00 00 00 48 ...............H
0x0000600000a48d71 00 00 00 00 00 00 00 00 01 00 00 00 00 00 00 00 ................
0x0000600000a48d81 00 00 00 00 00 00 00 00 ab 1f 00 00 60 00 00 71 ............`..q
0x0000600000a48d91 91 d8 c5 ff ff 1d 00 8c 07 00 00 01 00 00 00 17 ................
0x0000600000a48da1 64 6e 67 2e 61 64 6f 62 65 2e 63 61 6e 6f 6e 65 dng.adobe.canone
0x0000600000a48db1 6f 73 6d 2e 63 61 6d 00 00 00 00 00 00 00 00 e0 osm.cam.........
0x0000600000a48dc1 41 db c5 ff 7f 00 00 01 00 00 00 00 00 00 00 c0 A...............
0x0000600000a48dd1 be 43 00 00 60 00 00 d8 be 43 00 00 60 00 00 d8 .C..`....C..`...
0x0000600000a48de1 be 43 00 00 60 00 00 00 00 00 00 00 00 00 00 71 .C..`..........q
0x0000600000a48df1 91 d8 c5 ff ff 1d 00 8c 07 00 00 0b 00 00 00 13 ................
0x0000600000a48e01 49 6e 73 74 61 6c 6c 20 53 70 6f 74 69 66 79 2e Install.Spotify.
0x0000600000a48e11 61 70 70 00 00 00 00 00 00 00 00 00 00 00 00 11 app.............
0x0000600000a48e21 9c d8 c5 ff ff 1d 00 01 00 00 00 00 00 00 00 00 ................
0x0000600000a48e31 00 00 00 00 00 00 00 02 00 00 00 00 00 00 00 02 ................
...

Sure enough, looks like we’ve likely found the harborer of our historical entries! And, it makes sense, as I surmise Finder is the process responsible for creating these .DS_Store files when they are moved to the trash. How might we be able to find out what process is responsible for creating this file? OSX has a nice little utility called fs_usage that can monitor all sorts of file system, disk, I/O aspects. For our purposes/testing here, we are going to filter on filesystem events and grep for the .Trash/.DS_Store file we care about while I go into Finder and delete (send to the Trash) a file:

$ sudo fs_usage -w -f filesystem | grep ".Trash/.DS_Store"
09:15:48.854558 fsgetpath /Users/jp/.Trash/.DS_Store 0.000010 Finder.2394967
09:15:49.357252 fsgetpath /Users/jp/.Trash/.DS_Store 0.000008 Finder.2395226
09:15:53.751509 getattrlist /Users/jp/.Trash/.DS_Store 0.000041 Finder.2395226
09:15:53.751556 fsgetpath /Users/jp/.Trash/.DS_Store 0.000008 Finder.2395226
09:15:53.751576 getattrlist /Users/jp/.Trash/.DS_Store 0.000019 Finder.2395226
09:15:53.751589 fsgetpath /Users/jp/.Trash/.DS_Store 0.000005 Finder.2395226
09:15:53.751717 fsgetpath /Users/jp/.Trash/.DS_Store 0.000007 Finder.2395226
09:15:53.751738 open F=21 (_W____) /Users/jp/.Trash/.DS_Store 0.000019 Finder.2395226
09:15:53.752898 HFS_update (__M_____) /Users/jp/.Trash/.DS_Store 0.000009 Finder.2395226
09:15:53.752905 HFS_update (__MN_c_m) /Users/jp/.Trash/.DS_Store 0.000003 Finder.2395226
09:15:53.752929 HFS_update (___N____) /Users/jp/.Trash/.DS_Store 0.000004 Finder.2395226
09:15:53.752956 HFS_update (___N_c_m) /Users/jp/.Trash/.DS_Store 0.000004 Finder.2395226
09:15:53.753005 HFS_update (_FMN_c_m) /Users/jp/.Trash/.DS_Store 0.000004 Finder.2395226
09:15:53.753157 getattrlist /Users/jp/.Trash/.DS_Store 0.000016 Finder.2395226
09:15:53.754084 WrData[AN] D=0x043832a0 B=0x5000 /dev/disk1 /Users/jp/.Trash/.DS_Store 0.001077 W Finder.2395226
09:15:53.804058 fsgetpath /Users/jp/.Trash/.DS_Store 0.000005 Finder.2395372
09:15:54.293014 lstat64 /Users/jp/.Trash/.DS_Store 0.000030 fseventsd.2395383

Sure enough, there it is. We can see Finder (re)creating the .Trash/.DS_Store file. Pretty cool, huh?

Now, why these entries are re-populated instead of just creating a blank/zero’ed file, we don’t yet quite know (this would take some more intensive inspection of the Finder code itself). Nonetheless, the Finder process definitely looks like a solid candidate responsible for (re)storing these these historical entries.

For even further testing and corroboration of our above findings (additional corroboration is ALWAYS a good idea in both investigations and research), we can use Volatility’s strings plugin. For most effective use, this plugin actually relies on a strings output file (fed as input to the plugin) with each string entry prepended with the decimal offset at which it was found (e.g., “102515331 file.dmg”). Keep in mind that in addition to the standard ASCII strings, we will also want to extract the Unicode 16-bit Big Endian strings as well.

Here we will use the GNU strings utility (gstrings on OSX via brew) to acquire this needed output. As a bit of a pro-tip, below is a great way to extract both ASCII and Unicode (16-bit Big Endian) in parallel using a FIFO queue:

$ mkfifo part-out
$ gstrings -a -td part-out > Memory_Captures/mem.raw.strings.ascii &

[1] 40780
$ cat Memory_Captures/mem.raw | tee part-out | gstrings -a -td -eb > Memory_Captures/mem.raw.strings.be

Once completed, let’s check out the format and see what it found for both the ASCII and Unicode Big-Endian strings:

$ sift "canon-mx920-19_1_0a-ea11.dmg" Memory_Captures/mem.raw.strings.ascii
25099281 canon-mx920-19_1_0a-ea11.dmg
26248704 ;/Volumes/Untitled/.Trashes/501/canon-mx920-19_1_0a-ea11.dmg
219280449 canon-mx920-19_1_0a-ea11.dmg
405926145 canon-mx920-19_1_0a-ea11.dmg
1114934737 canon-mx920-19_1_0a-ea11.dmg
1422508032 e: canon-mx920-19_1_0a-ea11.dmg
1913326497 canon-mx920-19_1_0a-ea11.dmg
4364841040 File: canon-mx920-19_1_0a-ea11.dmg
4454621776 File: canon-mx920-19_1_0a-ea11.dmg
4897694289 canon-mx920-19_1_0a-ea11.dmg
5379226560 ;/Volumes/Untitled/.Trashes/501/canon-mx920-19_1_0a-ea11.dmg
6315679704 File: canon-mx920-19_1_0a-ea11.dmg
7262910545 canon-mx920-19_1_0a-ea11.dmg
7624221584 File: canon-mx920-19_1_0a-ea11.dmg
7720217424 File: canon-mx920-19_1_0a-ea11.dmg
7720218576 File: canon-mx920-19_1_0a-ea11.dmg
8317281252 File: canon-mx920-19_1_0a-ea11.dmg
8317281288 File: canon-mx920-19_1_0a-ea11.dmg
8317283615 File: canon-mx920-19_1_0a-ea11.dmg
8317283651 File: canon-mx920-19_1_0a-ea11.dmg
8555763408 File: canon-mx920-19_1_0a-ea11.dmg
8800666640 File: canon-mx920-19_1_0a-ea11.dmg
8876241680 File: canon-mx920-19_1_0a-ea11.dmg
9351045649 canon-mx920-19_1_0a-ea11.dmg
9821317328 File: canon-mx920-19_1_0a-ea11.dmg
10051278021 $File: canon-mx920-19_1_0a-ea11.dmg
10051278106 $File: canon-mx920-19_1_0a-ea11.dmg
10058241281 canon-mx920-19_1_0a-ea11.dmg
10166913457 canon-mx920-19_1_0a-ea11.dmg
10166914465 canon-mx920-19_1_0a-ea11.dmg
10215457371 File: canon-mx920-19_1_0a-ea11.dmg
10215457407 File: canon-mx920-19_1_0a-ea11.dmg
10215459734 File: canon-mx920-19_1_0a-ea11.dmg
10215459770 File: canon-mx920-19_1_0a-ea11.dmg

And, now for Unicode Big-Endian:

$ sift "canon-mx920-19_1_0a-ea11.dmg" Memory_Captures/mem.raw.strings.be
5128627554 canon-mx920-19_1_0a-ea11.dmg
5128627664 canon-mx920-19_1_0a-ea11.dmg
5128627732 canon-mx920-19_1_0a-ea11.dmg
10079999330 canon-mx920-19_1_0a-ea11.dmg
10079999440 canon-mx920-19_1_0a-ea11.dmg
10079999508 canon-mx920-19_1_0a-ea11.dmg
10090625584 ile:///Users/jp/Downloads/canon-mx920-19_1_0a-ea11.dmg}

As we saw before when running our Yara scans against memory, we find many resident artifacts of our file name strings. A bit less in our Unicode output, but possibly useful findings nonetheless. No surprise here. But, let’s feed each of these into Volatility’s strings plugin to get some more context.

$ ./volatility_2.6_mac64_standalone --plugins=/Users/jp/Projects/volatility/volatility/plugins/ --profile=Mac10_12_2_x64x64 -f ~/Projects/Memory_Captures/mem.raw mac_strings -s ~/Projects/Memory_Captures/mem.raw.strings.ascii

And, now we wait… one day… two days… until Schrödinger’s cat got the best of me and I killed the process. After receiving a pro-tip from @attrc to filter down the strings file to just what we cared about (the 4 file names we put int our Yara rules file), I whittled it down to approximately 288 string entries (down from over 45 million – gah!) and re-ran it:

$ ./volatility_2.6_mac64_standalone --plugins=/Users/jp/Projects/volatility/volatility/plugins/ --profile=Mac10_12_2_x64x64 -f ~/Projects/Memory_Captures/mem.raw mac_strings -s ~/Projects/Memory_Captures/mem.raw.strings.ascii_FILTERED

…and waited another day before killing it and instead running it on a much faster desktop machine. Alas, it still took over a day to run on a 2.8GHz core i7 with 32GB memory, and yielded the following output:

25099281 [kernel:feacc17efc11] canon-mx920-19_1_0a-ea11.dmg
26248704 [kernel:feacc1908600] ;/Volumes/Untitled/.Trashes/501/canon-mx920-19_1_0a-ea11.dmg
33366720 [kernel:feacc1fd22c0] File: SpotifyInstaller.zip
33369120 [kernel:feacc1fd2c20] File: FileZilla-Installer.app
33369264 [kernel:feacc1fd2cb0] File: BlockBlock_Installer.app
81507152 [kernel:feacc4dbb350] File: FileZilla-Installer.app
96602320 [kernel:feacc5c208d0] +/Users/jp/Downloads/FileZilla-Installer.ap
...
10215459594 [kernel:feaf20e38b0a] File: BlockBlock_Installer.app
10215459626 [kernel:feaf20e38b2a] File: BlockBlock_Installer.app
10215459658 [kernel:feaf20e38b4a] File: BlockBlock_Installer.app
10215459734 [kernel:feaf20e38b96] File: canon-mx920-19_1_0a-ea11.dmg
10215459770 [kernel:feaf20e38bba] File: canon-mx920-19_1_0a-ea11.dmg
10230120017 [kernel:feaf21c33e51] BlockBlock_Installer.app

“kernel”? That’s it? No process association?

Well, that’s unfortunately less than useful for us. According to the wiki entry for the strings plugin, “For a given image and a file with lines of the form :, or , output the corresponding process and virtual addresses where that string can be found.” In reading that, I expected output similar to (or better than) the yarascan plugin in being able to pair the string hit(s) to the associated process. Alas, ’tis not the case.

Nonetheless, we seem to have some very useful findings to satisfy hypothesis #2.

Conclusion

In conclusion, while hypothesis #2 looks rather satisfied by our testing, we are still left with the following questions:

1) Why are these entries re-populated when a .DS_Store file is re-created?
2) What causes this behavior?
3) How is this information pulled into the re-created .DS_Store file?
4) Why are only certain files resident and not every file ever deleted from the machine?*
*My testing shows that the entries are purged upon reboot, so this last question is mostly answered. Though, we still don’t know why it happens.

If anyone has any insight into this, I would be INCREDIBLY interested to hear about it.

/JP

Powered by WordPress & Theme by Anders Norén