Early in my DFIR career, I struggled with understanding how exactly to identify and understand all the RDP-related Windows Event Logs. I would read a few things here and there, think I understood it, then move on to the next case – repeating the same loop over and over again and never really acquiring full comprehension. That is until one day I finally got tired of repeating the same questions/research and just made a cheat sheet laying out the most common RDP-related Event ID’s that I’d encountered along with their relevance and descriptions. From that point on, as I sporadically encountered related questions/confusion from others in the community, I would simply refer to my cheat sheet to provide an immediate response or clarification – saving them from the hours of repeated questioning and research I had already done.
However, it seems the community continues to encounter the same struggle in identifying and understanding RDP-related Windows Event Log ID’s, where each is located, and even what some of them mean (no thanks to some of Microsoft’s very confusing documentation and descriptions). As such, I recently set out to try and find an easy route to the solution for this problem (i.e. hopefully find a single website to point to with all this information). Though I’ve found parts of the answer in posts here and there, each of them were missing parts of the puzzle (either missing ID’s, descriptions, explanations, and/or overall how they fit together in a chronological fashion). I will say JPCERTCC did an awesome job capturing a ton of information here, I just can’t quite decipher or discern the clear order of events and some appear out of order (at least how I have encountered them, but maybe I’m reading it wrong…). At any rate, as they say, necessity is the mother of invention.
So, I decided to create a blog post that I hope can serve as a succinct one-stop shop for understanding and identifying the most commonly encountered and empirically useful* RDP-related Windows Event Log ID’s/entries for tracking and investigating RDP usage on a Windows Vista+ endpoint. The Windows Event ID’s in the XP days were different than those in Vista+ Operating Systems. So, I decided to leave those out for now, but perhaps I will add them in the future.
*Yes, there are Event ID’s like 1146, 1147, and 1148 which look great in Microsoft’s documentation as a very useful source of information. However, I’ve yet to see (m)any of these commonly occurring in the wild.
I debated back and forth on the best way to sort/group these. Ultimately, in truly pragmatic fashion, I figured it would likely be most useful to sort them in the (chronological) order in which you might expect to find them. Ergo, the flow/section breakup is the following:
Network Connection
->-> Authentication
->-> Logon
->-> Session Disconnect/Reconnect
->-> Logoff
Network Connection
This section covers the first indications of an RDP logon – the initial network connection to a machine.
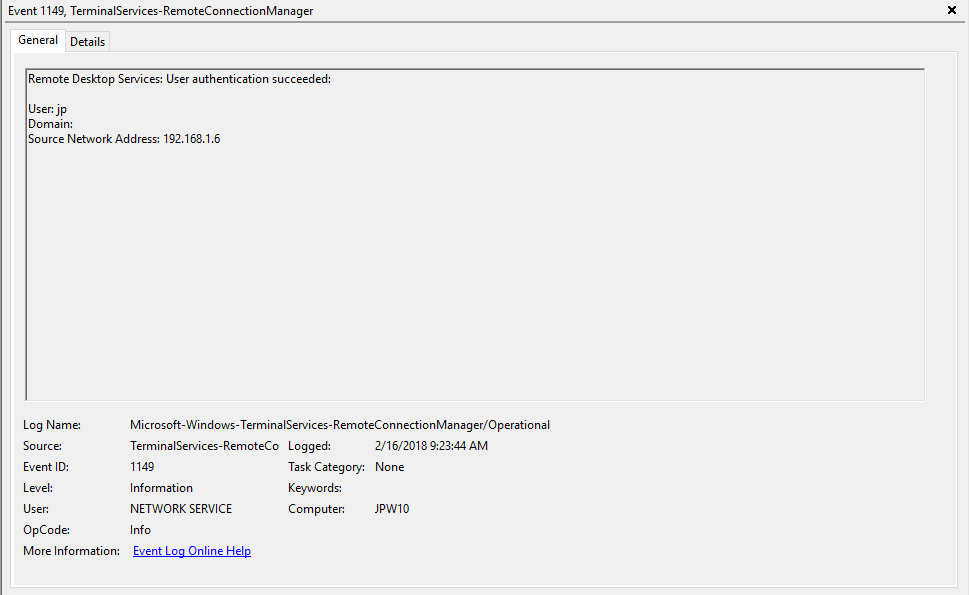
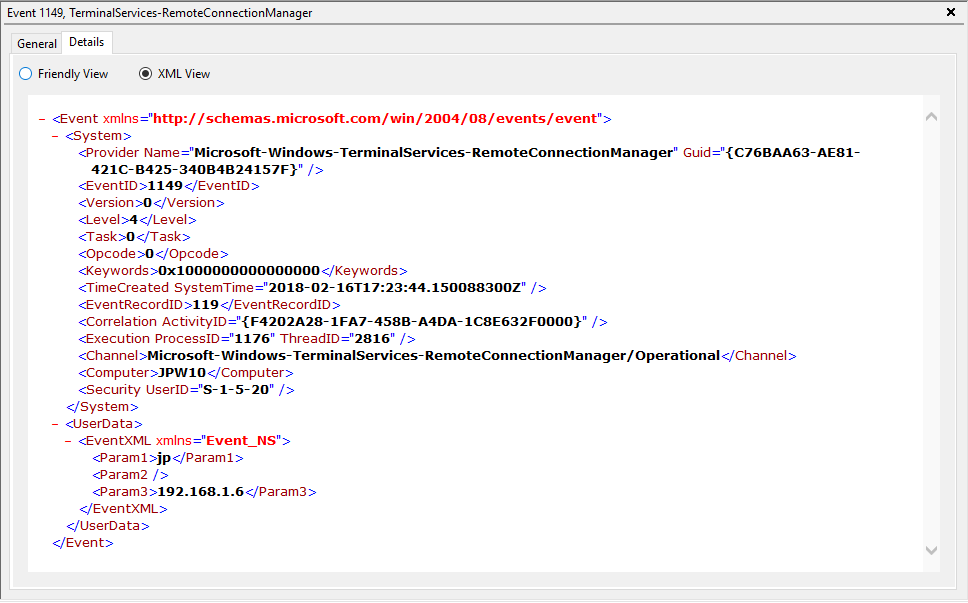
Log: Microsoft-Windows-Terminal-Services-RemoteConnectionManager/Operational
Log Location: %SystemRoot%\System32\Winevt\Logs\Microsoft-Windows-TerminalServices-RemoteConnectionManager%4Operational.evtx
Event ID: 1149
Provider Name: Microsoft-Windows-Terminal-Services-RemoteConnectionManager
Description: “User authentication succeeded”
Notes: Despite this seemingly clear-cut description, this event actually DOES NOT indicate a successful user authentication in the sense that many might expect (e.g., successful input and acceptance of a username and password). Instead, “authentication” in this sense is referring to successful network authentication, as in someone successfully executed an RDP network connection to the target machine and it successfully responded and displayed a login window for the next step of entering credentials. For example, if I launched the RDP Desktop Connection program on my computer, input a target IP, and hit enter, it would simply display the target system’s screen and produce an 1149 Event ID indicating I had successfully connected to the target, WELL BEFORE I even entered any credentials. So, repeat after me, “An Event ID 1149 DOES NOT indicate successful authentication to a target, simply a successful RDP network connection”.
TL;DR: NOT AN AUTHENTICATION. Someone launched an RDP client, specified the target machine (possibly with a username and domain), and hit enter to make a successful network connection to the target. Nothing more, nothing less.
Authentication
This section covers the authentication portion of the RDP connection – whether or not the logon is allowed based on success/failure of username/password combo.
Log: Security
Log Location: %SystemRoot%\System32\Winevt\Logs\Security.evtx
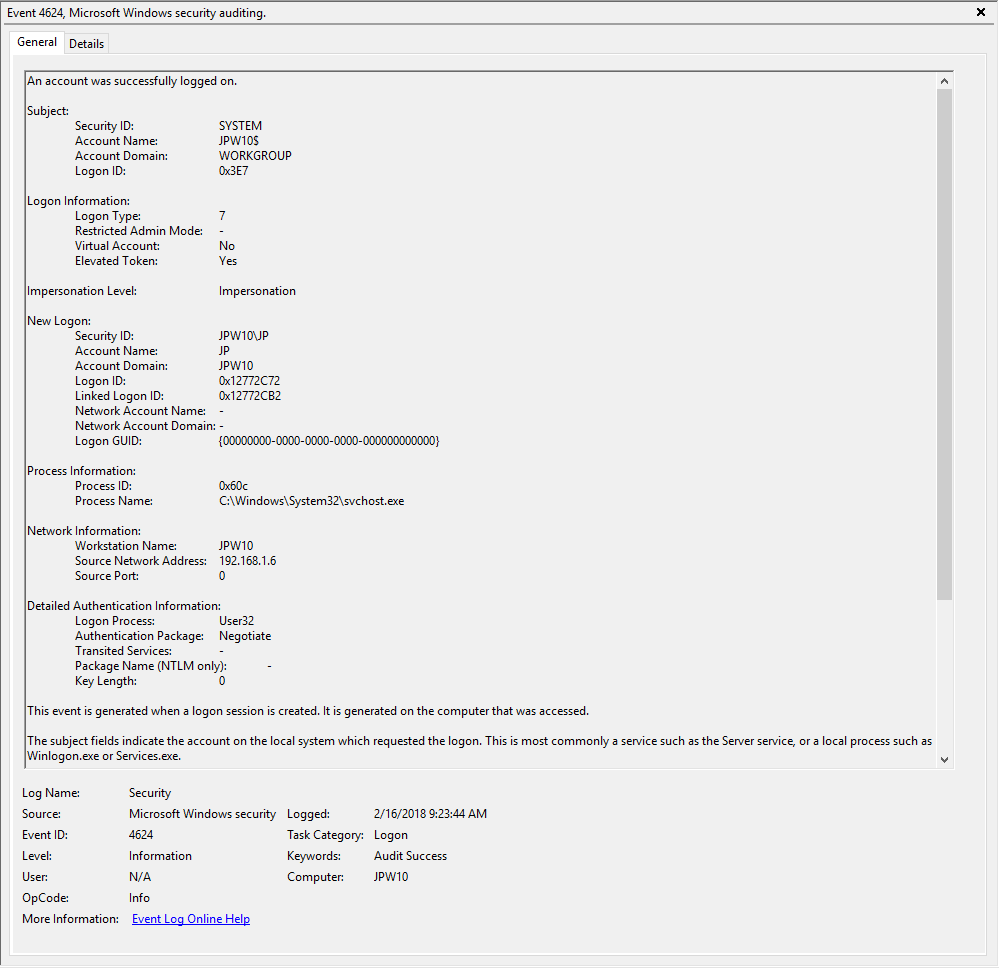
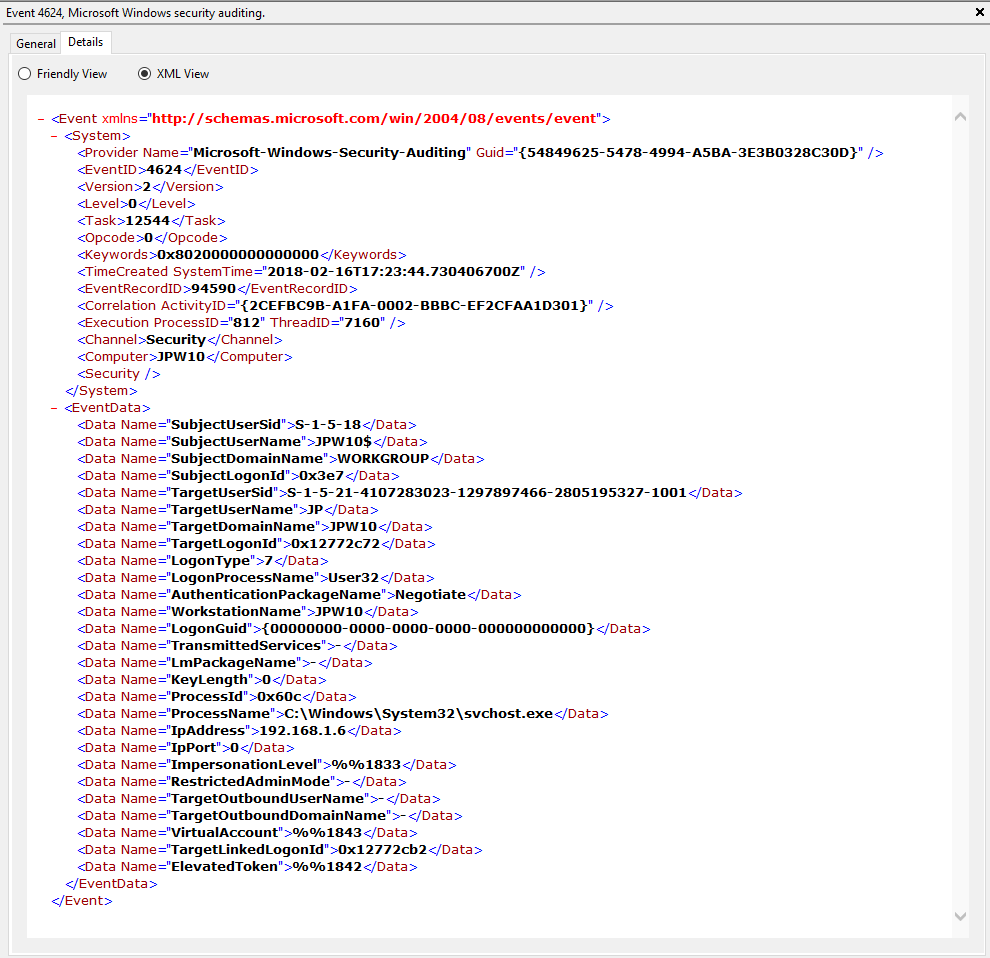
Event ID: 4624
Provider Name: Microsoft-Windows-Security-Auditing
LogonType: Type 3 (Network) when NLA is Enabled (and at times even when it’s not) followed by Type 10 (RemoteInteractive / a.k.a. Terminal Services / a.k.a. Remote Desktop) OR Type 7 from a Remote IP (if it’s a reconnection from a previous/existing RDP session)
Description: “An account was successfully logged on”
Notes: I thought this one was pretty straight forward – just look for Type 10 logons for RDP. However, in a bit more research, I discovered that often a Type 3 logon (for NLA) will occur prior to the Type 10 logon. In addition, I also discovered that RDP’ing to a system of which you’d previously RDP’ed and not formally logged off/out would instead yield a Logon Type 7 logon versus the Logon Type 10 we’d expect. This makes sense in a way in that a Logon Type 7 (“This workstation was unlocked”) is essentially what is happening. However, to delineate this from non-RDP Type 7 logons in which a person was sitting at the machine and just unlocked the machine, we can look for remote non-local IP’s in the IpAddress field.
TL;DR: User successfully logged on to this system with the specified TargetUserName and TargetDomainName from the specified IpAddress.
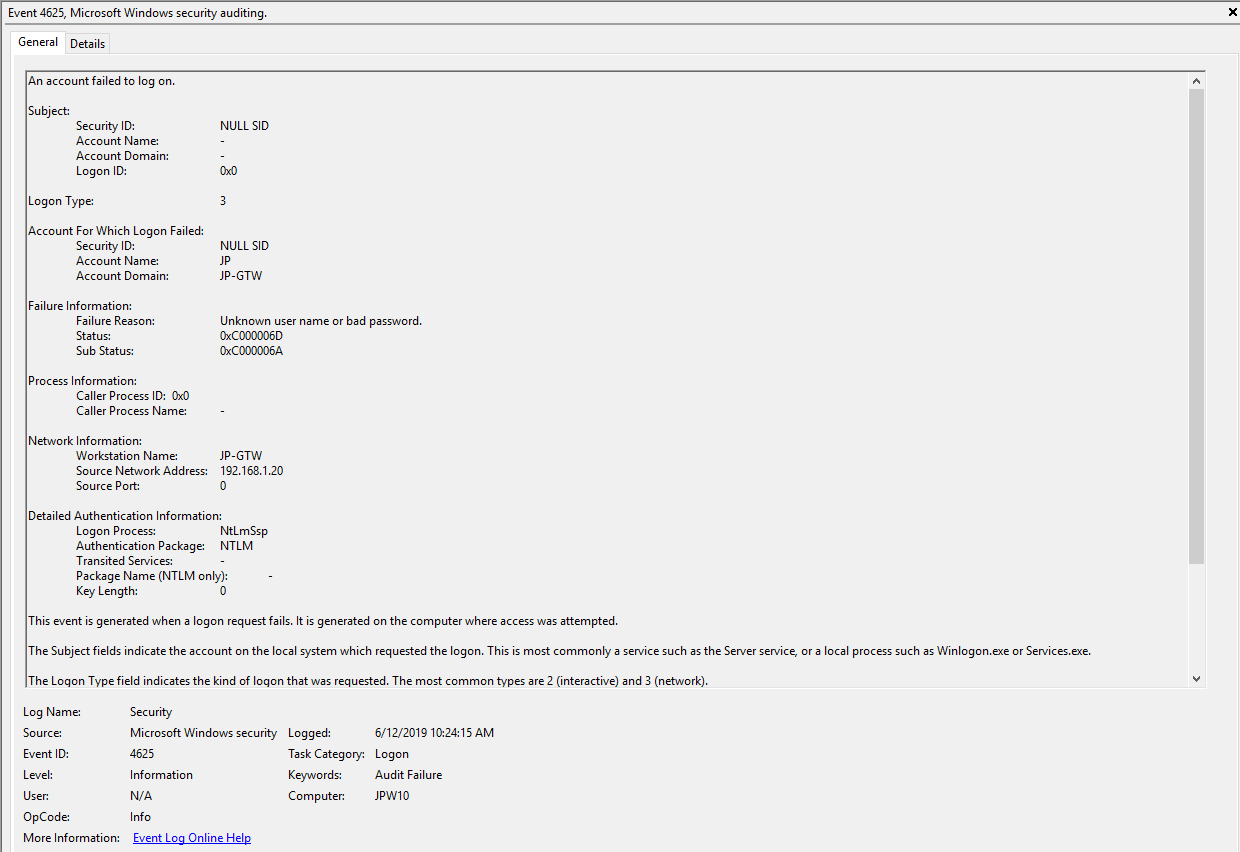
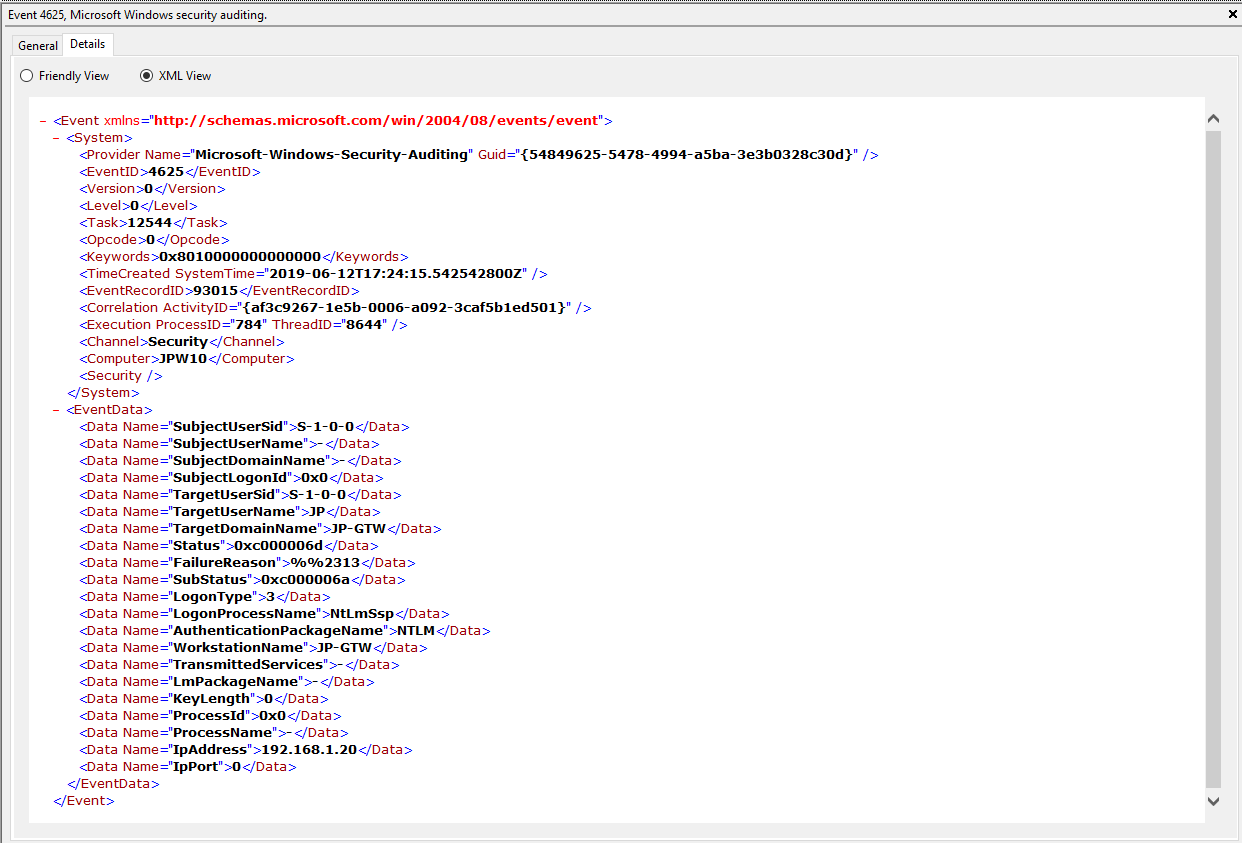
Event ID: 4625
Provider Name: Microsoft-Windows-Security-Auditing
LogonType: Type 3 (Network) when NLA is Enabled (and at times even when it’s not) and/or Type 10 (RemoteInteractive / a.k.a. Terminal Services / a.k.a. Remote Desktop)
Description: “An account failed to log on”
Notes: Why do we care about failures? Well, this is helpful in identifying (brute force) failure attempts and seeing when/where an attacker may be attempting stolen/compromised credentials. The Status/Sub Status Code will also be helpful in delineating legitimate failures (e.g. “expired password”) as well as possibly providing insight into attacker activity (e.g. repetitive “user name does not exist” codes could indicate brute force guessing by a tool and/or a more targeted lack of username knowledge/awareness in the environment by the attacker).
TL;DR: User failed to log on to this system with the specified TargetUserName and TargetDomainName from the specified IpAddress.
#ProTip(s):
1) When NLA is enabled, a failed RDP logon (due to wrong username, password, etc.) will result in a 4625 Type 3 failure. When NLA is not enabled, you *should* see a 4625 Type 10 failure.
2) Both of these entries also contain a “SubjectLogonID” or a “TargetLogonID” field. This ID is unique for each logon session and is also present in various other Event Log entries, making it theoretically useful for tracking/delineating a specific user’s activities, particularly on systems allowing multiple logged on users. However, do take note that a unique *LogonID is assigned for each session, meaning if a user connects, then disconnects (without logging out, thus simply ending the current session), then reconnects (i.e. starting a new session), they will be assigned a different unique *LogonID. All to say that a single user(name) may have multiple unique *LogonID’s to track depending how many sessions they’ve instantiated, not to mention Windows makes it very confusing sometimes with multiple 4624’s with different *LogonID’s for the same session. So, YMMV.
Additional References:
David Cowen’s Forensic Lunch Test Kitchen – RDP Testing (1 , 2 , 3)
Microsoft Forum Answer Re: RDP 4624 Type 3 Logons (link)
Logon
This section covers the ensuing (post-authentication) events that occur upon successful authentication and logon to the system.
Log: Microsoft-Windows-TerminalServices-LocalSessionManager/Operational
Log Location: %SystemRoot%\System32\Winevt\Logs\Microsoft-Windows-TerminalServices-LocalSessionManager%4Operational.evtx
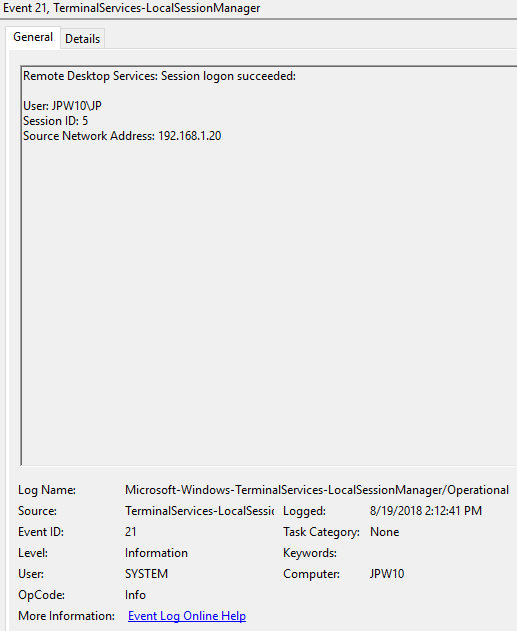
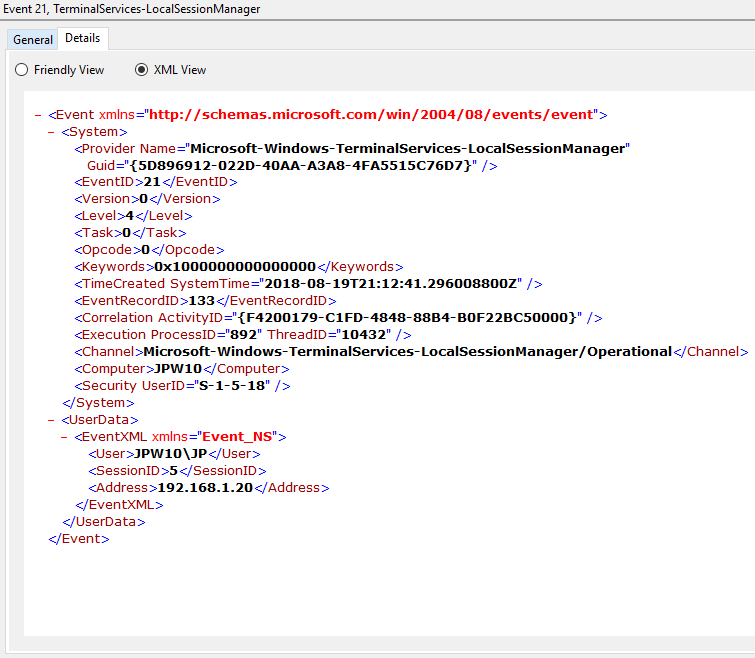
Event ID: 21
Provider Name: Microsoft-Windows-TerminalServices-LocalSessionManager
Description: “Remote Desktop Services: Session logon succeeded:”
Notes: This typically immediately precedes an Event ID 22 when the “Source Network Address” contains a remote IP address. Note that a “Source Network Address” of “LOCAL” simply indicates a local logon and does NOT indicate a remote RDP logon. this event with a “Source Network Address” of “LOCAL” will also be generated upon system (re)boot/initialization (shortly before the proceeding associated Event ID 22) . For remote RDP logons, take note of the SessionID as a means of tracking/associating additional Event Log activity with this user’s RDP session.
TL;DR: Indicates successful RDP logon and session instantiation, so long as the “Source Network Address” is NOT “LOCAL”.
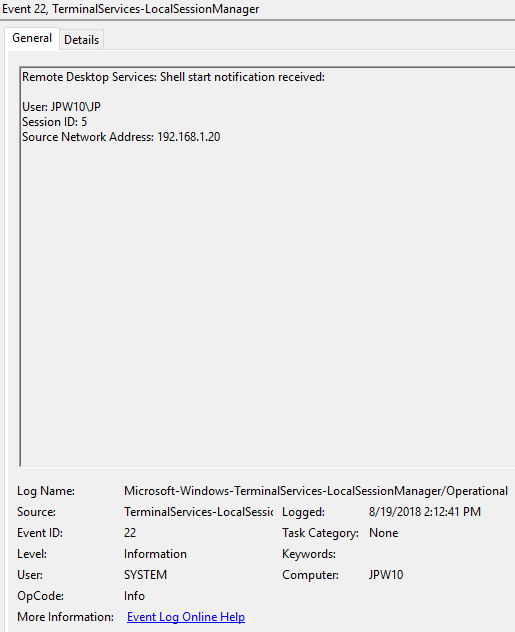
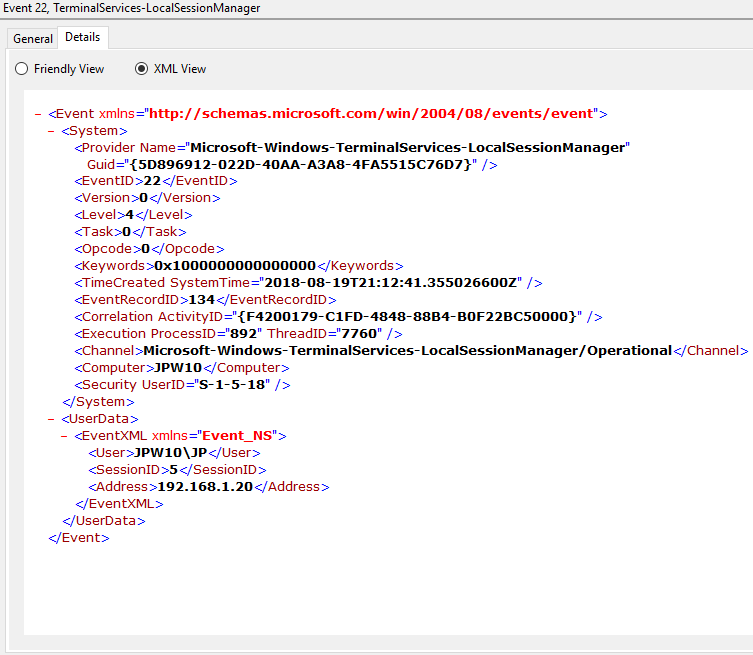
Event ID: 22
Provider Name: Microsoft-Windows-TerminalServices-LocalSessionManager
Description: “Remote Desktop Services: Shell start notification received:”
Notes: This typically immediately proceeds an Event ID 21. Note that a “Source Network Address” of “LOCAL” simply indicates a local logon and does NOT indicate a remote RDP logon. This event with a “Source Network Address” of “LOCAL” will also be generated upon system (re)boot/initialization (shortly after the preceding associated Event ID 21).
TL;DR: Indicates successful RDP logon and shell (i.e. Windows GUI Desktop) start, so long as the “Source Network Address” is NOT “LOCAL”.
Session Disconnect/Reconnect
This section covers the various session disconnect/reconnect events that might occur due to either system (idle), network (network disconnect), or purposeful user (X out of the RDP window, Start -> Disconnect, Kicked off by another user, etc.) action.
Log: Microsoft-Windows-TerminalServices-LocalSessionManager/Operational
Log Location: %SystemRoot%\System32\Winevt\Logs\Microsoft-Windows-TerminalServices-LocalSessionManager%4Operational.evtx
Event ID: 24
Provider Name: Microsoft-Windows-TerminalServices-LocalSessionManager
Description: “Remote Desktop Services: Session has been disconnected:”
Notes: The user has disconnected from an RDP session, when the “Source Network Address” contains a remote IP address. A “Source Network Address” of “LOCAL” simply indicates a local session disconnection and does NOT indicate a remote RDP disconnection. Note the “Source Network Address” for the source of the RDP connection. This is typically paired with an Event ID 40. Also take note of the SessionID as a means of tracking/associating additional Event Log activity with this user’s RDP session.
TL;DR: The user has disconnected from an RDP session, so long as the “Source Network Address” is NOT “LOCAL”.


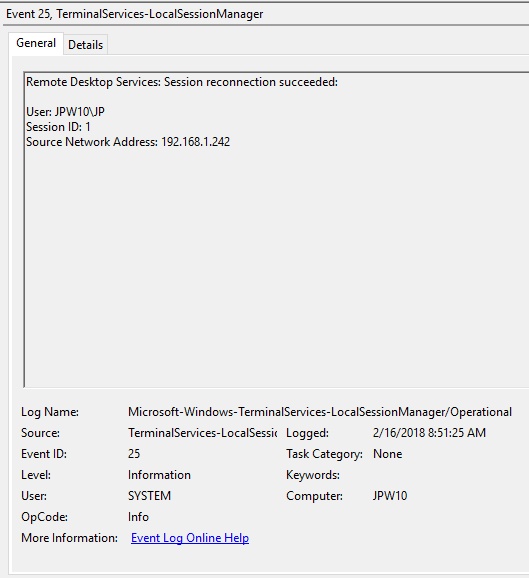
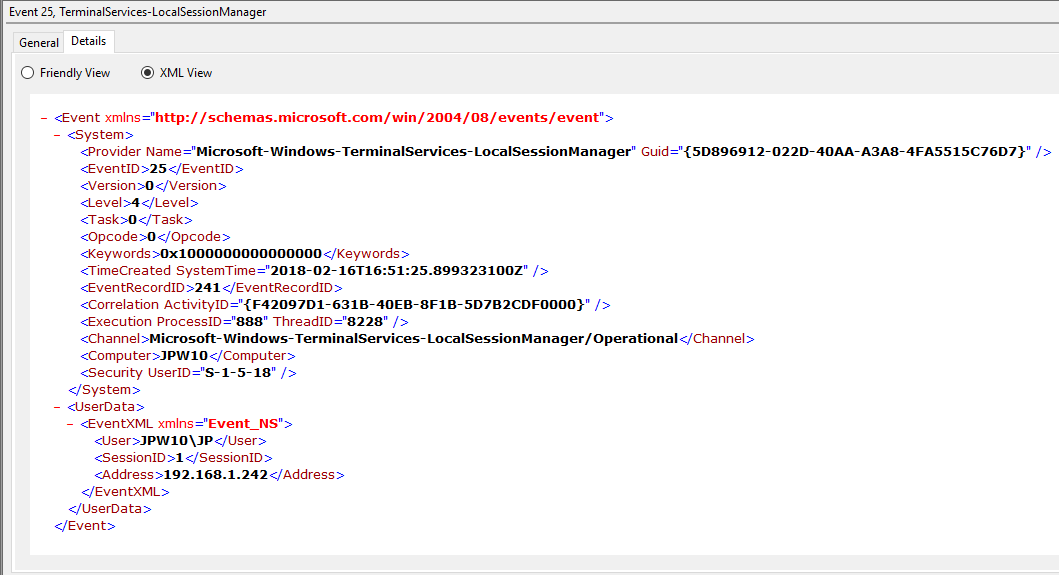
Event ID: 25
Provider Name: Microsoft-Windows-TerminalServices-LocalSessionManager
Description: “Remote Desktop Services: Session reconnection succeeded:”
Notes: The user has reconnected to an RDP session, when the “Source Network Address” contains a remote IP address. A “Source Network Address” of “LOCAL” simply indicates a local session reconnection and does NOT indicate a remote RDP session reconnection. Note the “Source Network Address” for the source of the RDP connection. This is typically paired with an Event ID 40. Take note of the SessionID as a means of tracking/associating additional Event Log activity with this user’s RDP session.
TL;DR: The user has reconnected to an existing RDP session, so long as the “Source Network Address” is NOT “LOCAL”.
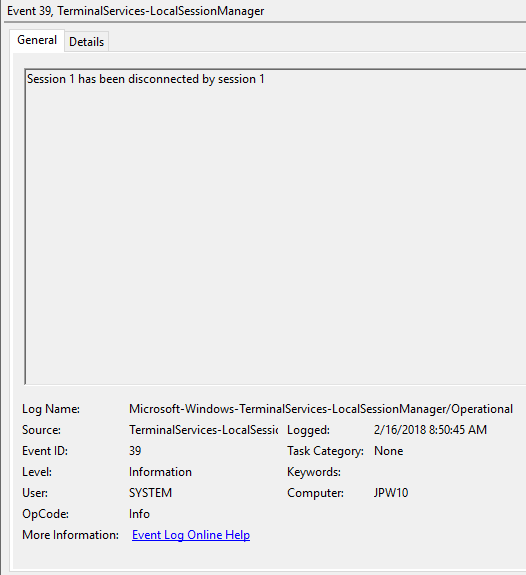
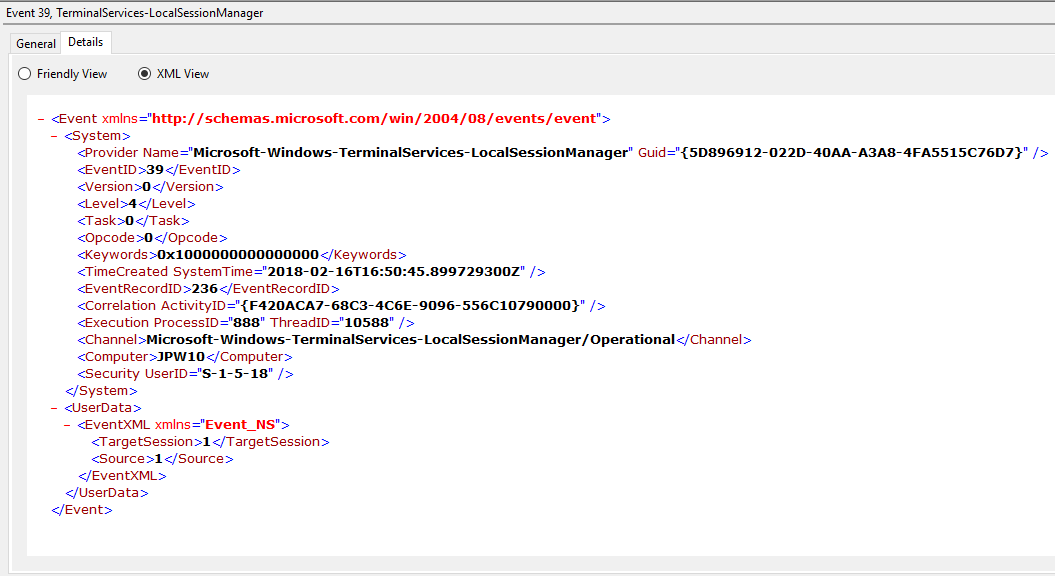
Event ID: 39
Provider Name: Microsoft-Windows-TerminalServices-LocalSessionManager
Description: “Session <X> has been disconnected by session <Y>”
Notes: This indicates that a user has formally disconnected from an RDP session via purposeful Disconnect (e.g., via the Windows Start Menu Disconnect option) versus simply X’ing out of the RDP window. Cases where the Session ID of <X> differs from <Y> may indicate a separate RDP session has disconnected (i.e. kicked off) the given user.
TL;DR: The user formally disconnected from the RDP session.
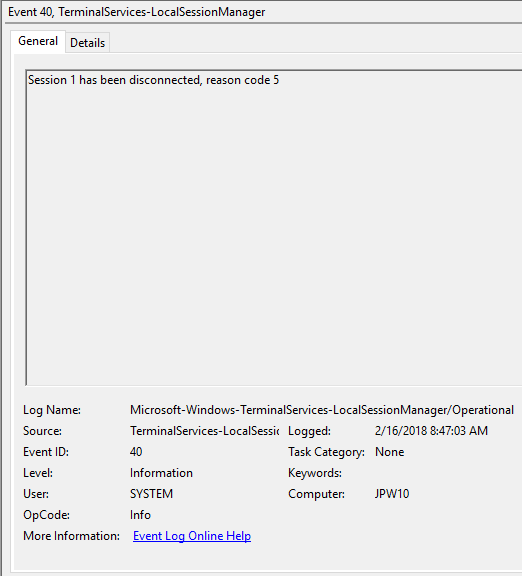
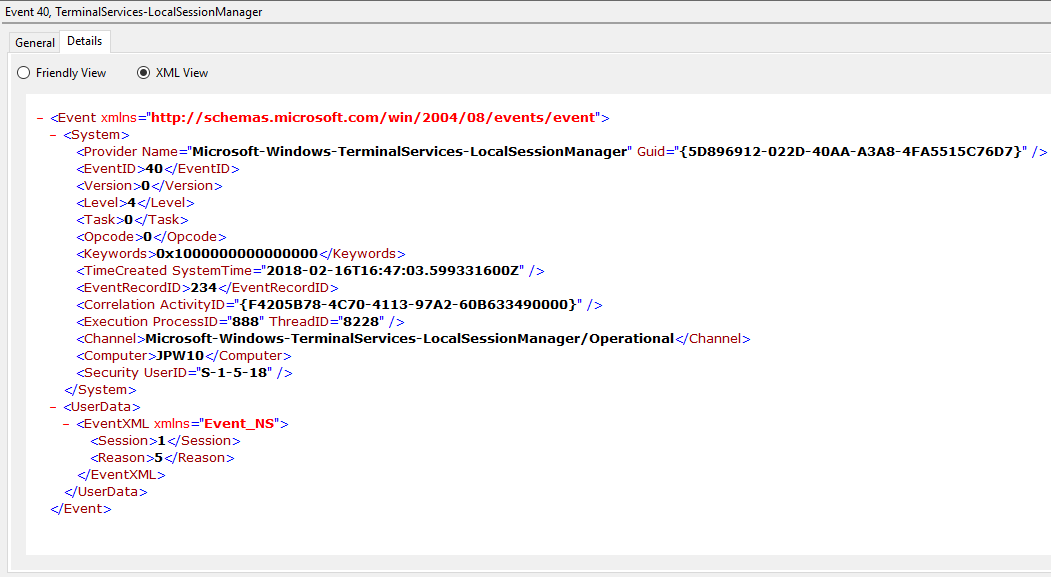
Event ID: 40
Provider Name: Microsoft-Windows-TerminalServices-LocalSessionManager
Description: “Session <X> has been disconnected, reason code <Z>”
Notes: In true Microsoft fashion, although the description is always “Session has been disconnected”, these events also indicate/correlate to reconnections, not just disconnections. The most helpful information here is the Reason Code (a function of the IMsRdpClient::ExtendedDisconnectReason property), the list of which can be seen here (and this pairs it with the codes to make it easier to read). Below are some examples of codes I encountered during my research.
0 – “No additional information is available.” (Occurs when a user informally X’es out of a session, typically paired with Event ID 24)
5 – “The client’s connection was replaced by another connection.” (Occurs when a user reconnects to an RDP session, typically paired with an Event ID 25)
11 – “User activity has initiated the disconnect.” (Occurs when a user formally initiates an RDP disconnect, for example via the Windows Start Menu Disconnect option.)
TL;DR: The user disconnected from or reconnected to an RDP session.
Log: Security
Log Location: %SystemRoot%\System32\Winevt\Logs\Security.evtx
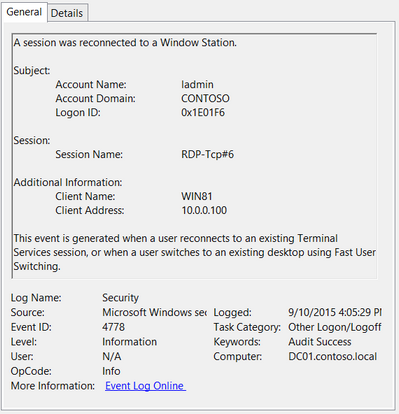
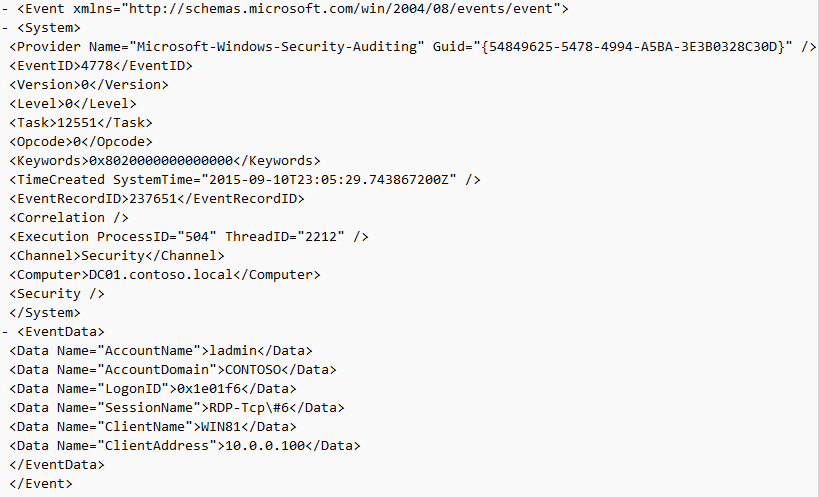
Event ID: 4778
Provider Name: Microsoft-Windows-Security-Auditing
Description: “A session was reconnected to a Window Station.”
Notes: Occurs when a user reconnects to an existing RDP session. Typically paired with Event ID 25. The SessionName, ClientAddress, and LogonID can all be useful for identifying the source and associated activity.
TL;DR: The user reconnected to an existing RDP session.
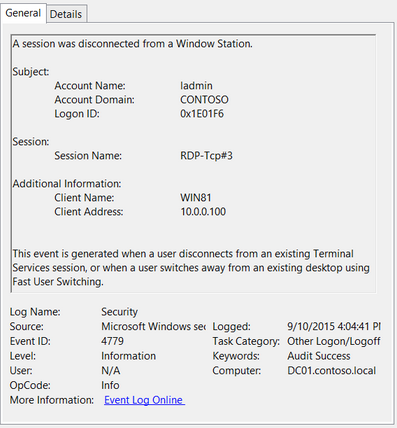
Event ID: 4779
Provider Name: Microsoft-Windows-Security-Auditing
Description: “A session was disconnected from a Window Station.”
Notes: Occurs when a user disconnects from an RDP session. Typically paired with Event ID 24 and likely Event ID’s 39 and 40. The SessionName, ClientAddress, and LogonID can all be useful for identifying the source and associated activity.
TL;DR: The user disconnected from from an RDP session.

Logoff
This section covers the events that occur after a purposeful (Start -> Disconnect, Start -> Logoff) logoff.
Log: Microsoft-Windows-TerminalServices-LocalSessionManager/Operational
Log Location: %SystemRoot%\System32\Winevt\Logs\Microsoft-Windows-TerminalServices-LocalSessionManager%4Operational.evtx
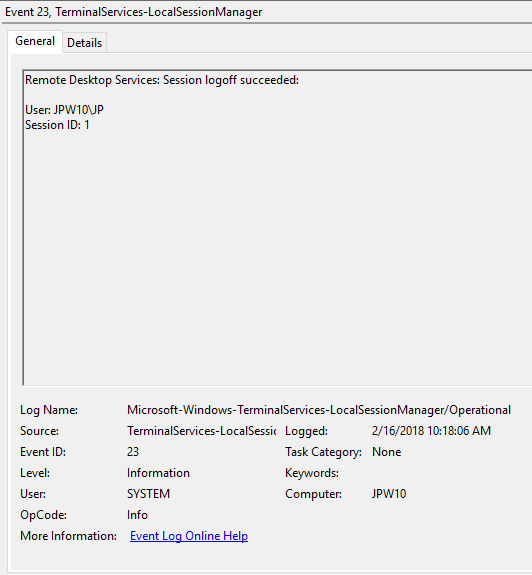
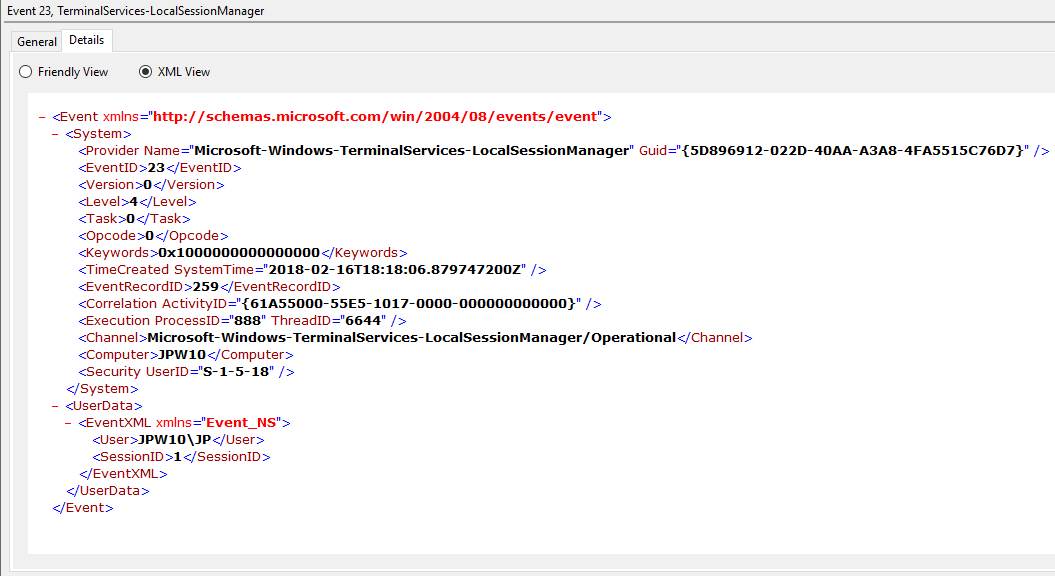
Event ID: 23
Provider Name: Microsoft-Windows-TerminalServices-LocalSessionManager
Description: “Remote Desktop Services: Session logoff succeeded:”
Notes: The user has initiated a logoff. This is typically paired with an Event ID 4634 (logoff). Take note of the SessionID as a means of tracking/associating additional Event Log activity with this user’s RDP session. This event with a will also be generated upon a system shutdown/reboot.
TL;DR: The user initiated a formal system logoff (versus a simple session disconnect).
Log: Security
Log Location: %SystemRoot%\System32\Winevt\Logs\Security.evtx
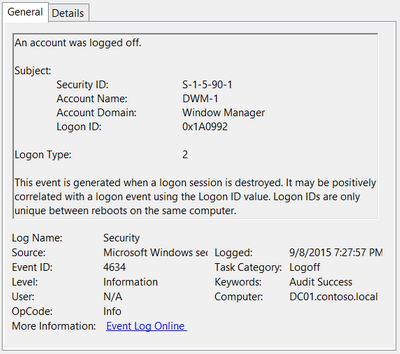
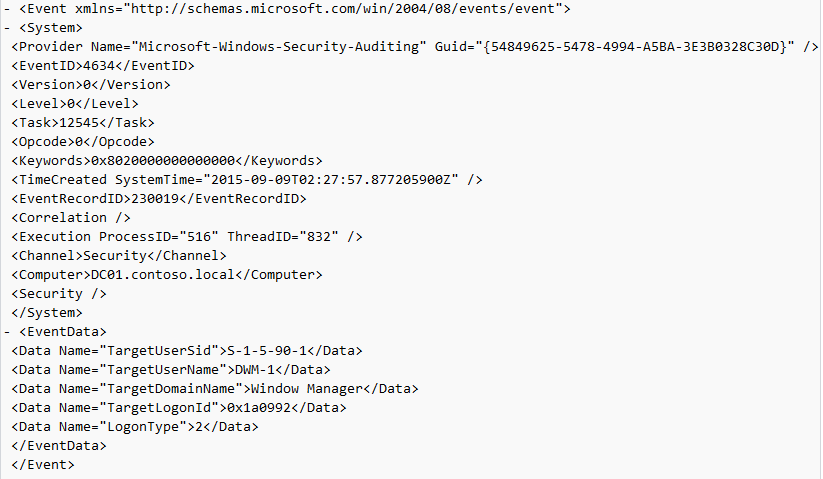
Event ID: 4634
Provider Name: Microsoft-Windows-Security-Auditing
LogonType: 10 (RemoteInteractive / a.k.a. Terminal Services / a.k.a. Remote Desktop) OR Type 7 from a Remote IP (if it’s a reconnection from a previous/existing RDP session)
Description: “An account was logged off.”
Notes: These occur whenever a user simply disconnects from an RDP session or formally logs off (via Windows Start Menu Logoff). This is typically paired with an Event ID 21 (RDP Session Logoff). I’ve also discovered these will also be paired (i.e. occur at the same time) with successful authentications (Event ID 4624). Why, I have no idea.
TL;DR: A user disconnected from, or logged off, an RDP session.
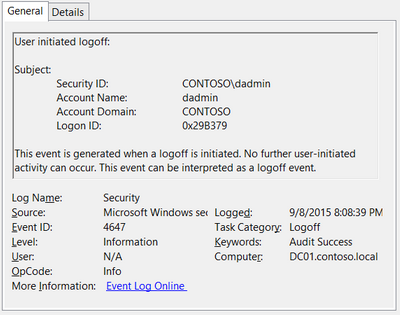
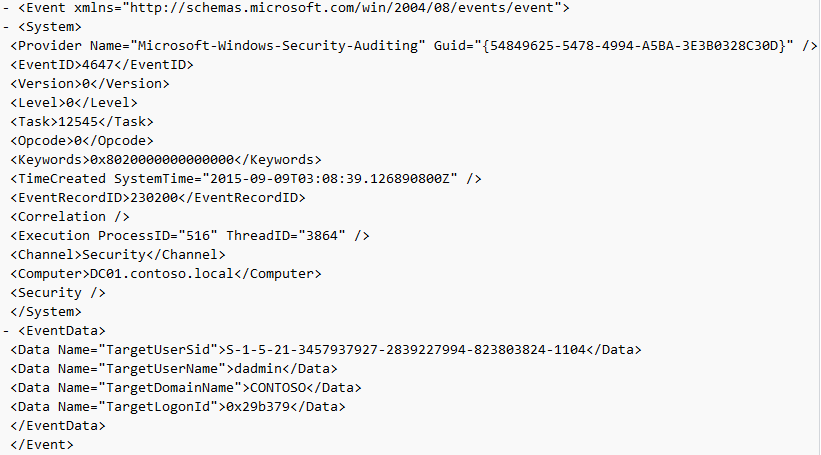
Event ID: 4647
Provider Name: Microsoft-Windows-Security-Auditing
Description: “User initiated logoff:”
Notes: Occurs when a user initiates a formal system logoff and is not necessarily RDP specific. You will need to use some reasoning and temporal analysis to understand if/when it is related to a system logoff via an RDP session or is from a local interactive session as there is no LogonType associated specify which it is.
TL;DR: The user initiated a formal logoff (NOT a simple disconnect).
Log: System
Log Location: %SystemRoot%\System32\Winevt\Logs\System.evtx
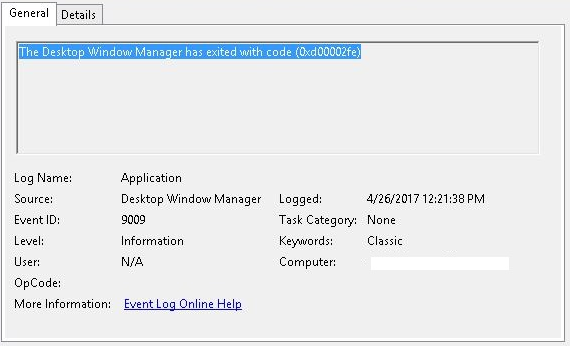
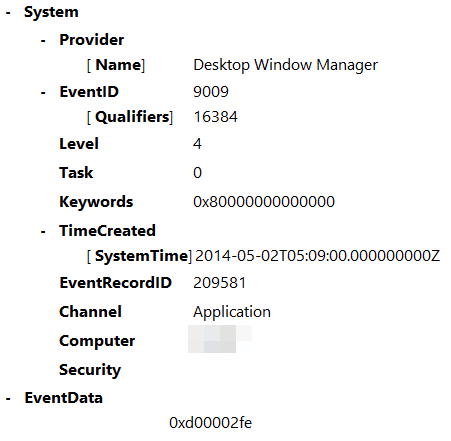
Event ID: 9009
Provider Name: Desktop Window Manager
Description: “The Desktop Window Manager has exited with code (<X>).”
Notes: Occurs when a user formally closes an RDP connection and indicates the RDP desktop GUI has been shut down as a result. This is useful to identify a closed/finalized RDP connection. Though, this event is not always produced for reasons I do not know.
TL;DR: A user has closed out an RDP connection.
Wrap-Up
Hopefully that provides a little better insight into some of the most common and (IME) most empirically useful RDP-related Event logs, when/where you might encounter them, what they mean, what they look like, and (most importantly) how they all fit together.
As a result of this post, Richard Davis (@richarddavisg, @13CubedDFIR) of 13Cubed on YouTube has also put together an RDP flow chart that is very helpful in visualizing the expected (though, not guaranteed) flow of these logs. Feel free to check out his short video walkthrough as well.